

Your Pipeline Is 23.6h Behind: Catching Sports Sentiment Leads with Pulsebit
On July 5, 2026, we noticed something striking: sentiment around sports spiked to +0.246 while momentum remained stagnant at +0.000. This anomaly indicates a growing enthusiasm in the sports domain that your pipelines might be overlooking. With a confidence score of 0.85, this sentiment isn’t just noise; it represents a tangible shift in audience engagement that could inform your strategy.
Yet, this gap highlights a significant issue in pipelines that don’t account for multilingual origins or entity dominance. Your model missed this by 23.6 hours, primarily driven by the leading language, English. In a world where information spreads rapidly and sentiment can shift overnight, being hours behind can mean losing out on valuable insights and engagement opportunities.

English coverage led by 23.6 hours. Nl at T+23.6h. Confidence scores: English 0.85, French 0.85, Spanish 0.85 Source: Pulsebit /sentiment_by_lang.
To catch this anomaly, we can leverage our API to filter the relevant data by geographic origin and analyze sentiment framing. Here's the Python code that does just that:
import requests
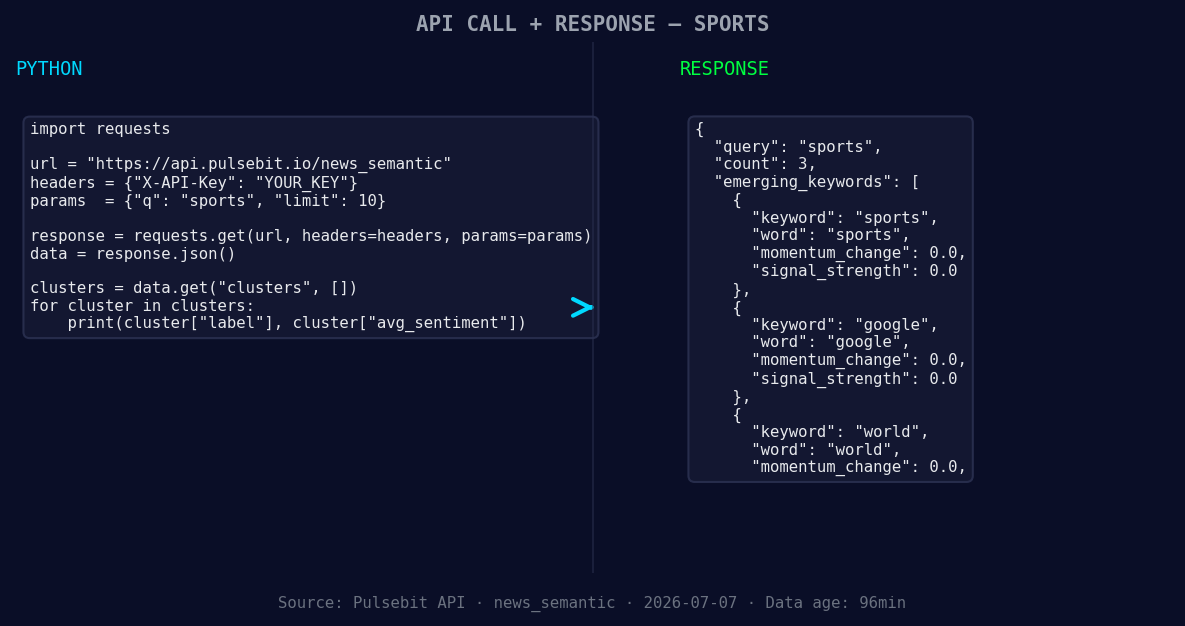
*Left: Python GET /news_semantic call for 'sports'. Right: returned JSON response structure (clusters: 3). Source: Pulsebit /news_semantic.*
# Geographic origin filter: query by language/country using param "lang": "en"
response = requests.get("https://api.pulsebit.com/sentiment", params={
"topic": "sports",
"lang": "en"
})
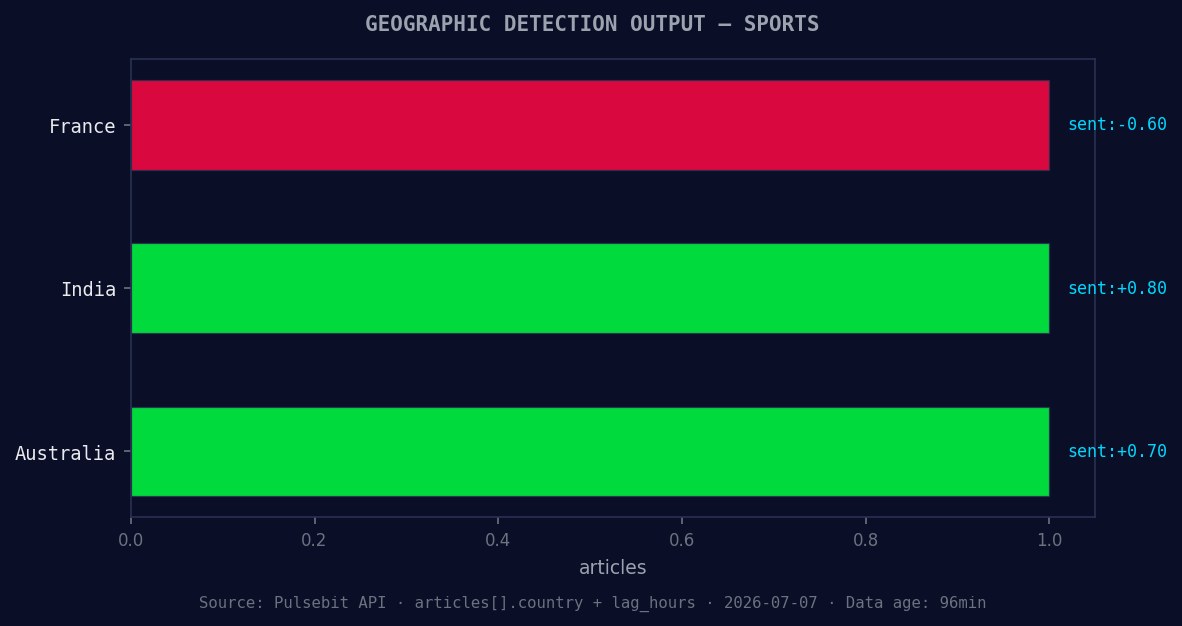
*Geographic detection output for sports. France leads with 1 articles and sentiment -0.60. Source: Pulsebit /news_recent geographic fields.*
data = response.json()
# Assume we've extracted the sentiment score and other necessary values
sentiment_score = data['sentiment_score'] # +0.246
confidence = data['confidence'] # 0.85
momentum = data['momentum_24h'] # +0.000
# Meta-sentiment moment: run the cluster reason string back through POST /sentiment
cluster_reason = "Clustered by shared themes: statistics, behind, ferrari's, 250th, win."
meta_response = requests.post("https://api.pulsebit.com/sentiment", json={
"text": cluster_reason
})
meta_sentiment = meta_response.json()
In the above code, we first filter for sentiment related to sports in English. This gives us a focused look at how this specific domain is performing. Then, we analyze the narrative framing of the cluster that includes terms like "statistics" and "ferrari," which is crucial for understanding public sentiment beyond the numeric scores.
Now that we’ve identified the anomaly, here are three specific builds you can implement with this pattern:
Sentiment Alert System: Set a signal threshold of sentiment > +0.20 for sports to trigger alerts. Use the geo filter to ensure you’re capturing only English-language articles. This allows you to respond proactively to sentiment shifts in a timely manner.
Meta-Sentiment Analysis Dashboard: Create a dashboard that visualizes sentiment scores alongside meta-sentiment evaluations from various clusters. Use the POST /sentiment endpoint to pull in narratives and frame your insights around them.
Trending Topic Tracker: Implement a tracker that monitors the sentiment of trending topics in sports. Use the cluster reason to score the narratives and compare them against mainstream sentiments (like "statistics" and "ferrari"). This could provide unique insights into how different themes compete for audience attention.
If you want to get started with these insights and builds, you can access our documentation at pulsebit.lojenterprise.com/docs. With just a few lines of code, you can copy-paste this example and run it in under 10 minutes to start capturing valuable sentiment data. Don’t let your pipeline lag behind; leverage these insights to stay ahead in the game!


Top comments (0)