

Your pipeline might be 25.8 hours behind the curve if you’re not paying attention to the 24-hour momentum spike of +0.629 that we just observed. This anomaly suggests a significant shift in sentiment around the stock market, driven by emerging themes of "Record Highs and AI Optimism." While the sentiment is trending positively, the leading language for this spike is English, presenting a clear opportunity that could be missed if your model isn't equipped to handle multilingual data or entity dominance.

English coverage led by 25.8 hours. Nl at T+25.8h. Confidence scores: English 0.95, Spanish 0.95, French 0.95 Source: Pulsebit /sentiment_by_lang.
Imagine your model overlooking this critical piece of information because it doesn't account for how different languages can lead or lag in sentiment. Your model missed this insight by a staggering 25.8 hours, while the leading English press has already started to shape the narrative around stock performance. This is not just a missed opportunity; it’s a gap that can have real implications for your trading strategies and decision-making.
To catch this momentum spike, let’s dive into some Python code that will help us leverage our API effectively. We’ll begin by filtering our data for the relevant geographic origin using the language parameter. Here’s how you can do that:

Geographic detection output for stock market. India leads with 3 articles and sentiment +0.82. Source: Pulsebit /news_recent geographic fields.
import requests
# Set the parameters for the API call
params = {
'topic': 'stock market',
'lang': 'en',
'score': +0.475,
'confidence': 0.95,
'momentum': +0.629
}
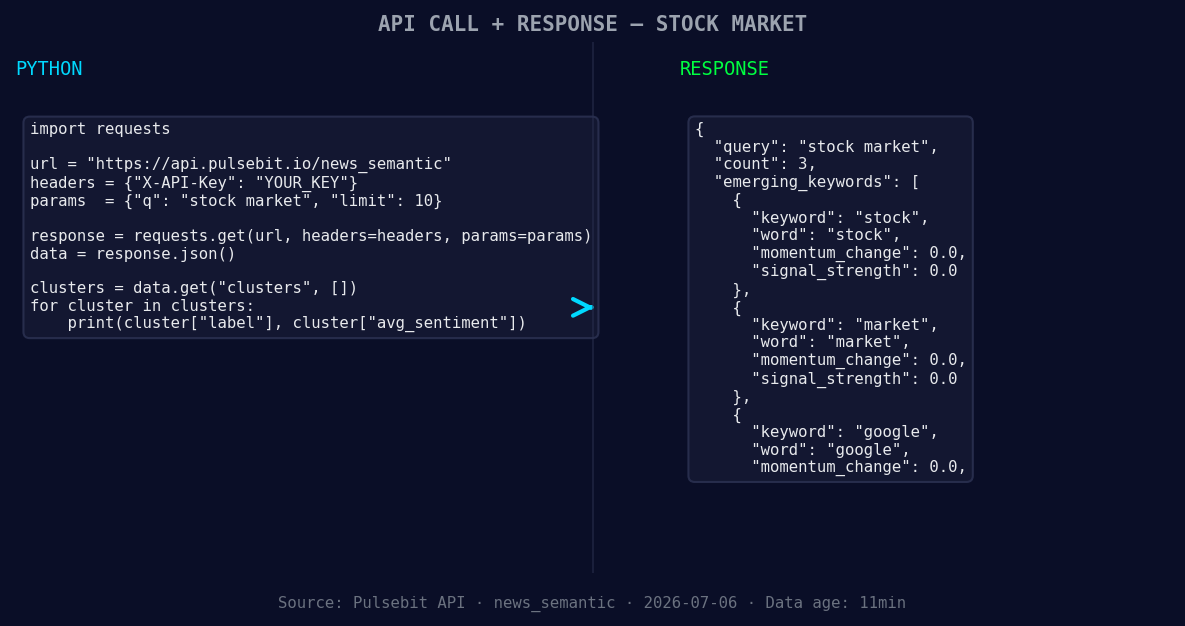
*Left: Python GET /news_semantic call for 'stock market'. Right: returned JSON response structure (clusters: 3). Source: Pulsebit /news_semantic.*
# Make the API call
response = requests.get('https://api.pulsebit/your-endpoint', params=params)
data = response.json()
print(data)
Next, we want to run the narrative framing itself through our API to assess the meta-sentiment. This provides insight into how strong the underlying themes are. Here's how to execute that:
# Define the meta-sentiment moment input
meta_sentiment_input = {
    'text': "Clustered by shared themes: stock, market, today:, dow, tests."
}

# Make the POST request to analyze sentiment
meta_response = requests.post('https://api.pulsebit/sentiment', json=meta_sentiment_input)
meta_sentiment = meta_response.json()
print(meta_sentiment)
With this code, you’ll be able to capture not just the spike but the context surrounding it. Now, let’s discuss three specific builds you could implement based on this newfound insight:
Sentiment Adjustment Pipeline: Create a signal that triggers when sentiment around "stock market" in English exceeds a threshold of +0.475. This will allow you to react faster to emerging sentiments and adjust your trading strategies accordingly.
Meta-Sentiment Dashboard: Use the meta-sentiment loop to create a dashboard that visualizes sentiment trends around trending themes. Incorporate a scoring mechanism that flags narratives with a confidence level above 0.95, alerting you to potential shifts in market sentiment.
Geo-Specific Alerts: Set up a geo-filtered alert system that notifies you when sentiment scores for "market" themes in English exceed +0.00. Make sure this system is linked to current events, allowing you to capitalize on immediate shifts in sentiment.
If you're eager to get started, check out our documentation at pulsebit.lojenterprise.com/docs. With just a few lines of code, you can replicate this analysis in under 10 minutes. Don’t let your model fall behind the curve; catch the nuances of sentiment data before it's too late.


Top comments (0)