Your Pipeline Is 27.7h Behind: Catching Commodities Sentiment Leads with Pulsebit
We recently noticed a striking anomaly: a 24h momentum spike of +0.200 in sentiment surrounding commodities. This isn’t just a random blip; it’s a clear signal that something significant is happening. The leading language for this spike is English, with a 27.7-hour lead time, meaning your models might be lagging behind by nearly a day. If you’re not equipped to handle multilingual origins or prominent entities, you could be missing critical insights like these.

English coverage led by 27.7 hours. Ro at T+27.7h. Confidence scores: English 0.75, Spanish 0.75, French 0.75 Source: Pulsebit /sentiment_by_lang.
This gap reveals a structural flaw in any pipeline that doesn’t adequately account for language dominance or the geographic origin of sentiments. Your model missed this by 27.7 hours, focusing solely on local or less relevant sources, while English press articles were already identifying key drivers in China's commodity imports. This delay can lead to missed opportunities or misinformed decisions.

Geographic detection output for commodities. India leads with 5 articles and sentiment +0.33. Source: Pulsebit /news_recent geographic fields.
Here’s how we can catch this momentum spike in our pipeline using our API. Below is a Python snippet that queries for sentiment data related to commodities, applying a geographic origin filter to capture the English-speaking narratives:
import requests
# Define parameters for API call
params = {
"topic": "commodities",
"lang": "en",
"score": +0.079,
"confidence": 0.75,
"momentum": +0.200
}
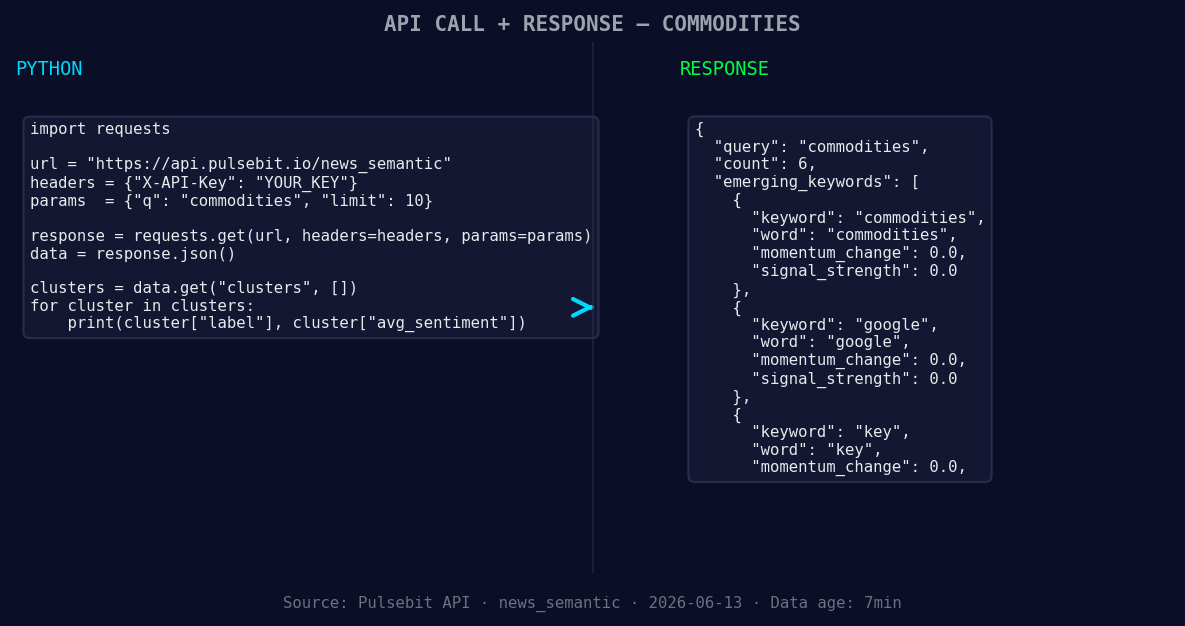
*Left: Python GET /news_semantic call for 'commodities'. Right: returned JSON response structure (clusters: 3). Source: Pulsebit /news_semantic.*
# Make the API call
response = requests.get('https://api.pulsebit.com/sentiment', params=params)
data = response.json()
print(data)
Next, we want to score the narrative framing itself. We’ll run the cluster reason string through our sentiment analysis endpoint to ensure we capture the meta-sentiment around it. Here’s how we do that:
meta_sentiment_payload = {
    "text": "Clustered by shared themes: intraday, targets/key, commodities, levels, tradingv"
}

# POST request for meta-sentiment analysis
meta_response = requests.post('https://api.pulsebit.com/sentiment', json=meta_sentiment_payload)
meta_data = meta_response.json()
print(meta_data)
With these two snippets, you’ll be equipped to not only catch the initial sentiment spike but also analyze the narrative framing that accompanies it.
Now, let’s talk about specific builds that can help you capitalize on this data. Here are three actionable ideas:
Geo-Filtered Alerts: Set up a real-time alert system that triggers when sentiment in English for commodities spikes above a +0.200 threshold. This ensures you’re always aware of significant changes right as they happen.
Meta-Sentiment Dashboard: Create a dashboard that visualizes the meta-sentiment for clusters identified in your analysis. For example, track narratives around “intraday” and “key” commodities, allowing you to quickly assess sentiment shifts.
Dynamic Content Strategy: Leverage the insights from your meta-sentiment analysis to inform your content strategy. If the narrative indicates rising interest in specific commodities, adjust your messaging to align with these emerging themes, such as commodities and key price drivers.
By using our API, you can start building these features and avoid being 27.7 hours behind the curve. For more information on how to get started, check out our documentation at pulsebit.lojenterprise.com/docs. You can copy-paste the code snippets above and run them in under 10 minutes to start catching these critical sentiment leads right away.

Top comments (0)