

Your 24h momentum spike of -0.524 in software sentiment caught our attention, and it’s an anomaly we can't ignore. This signal is significant, especially given that it’s being led by English press articles clustering around themes of engineering, college, lab, and IBM. With just one article contributing to this narrative, there’s a strong indication that sentiment is shifting, yet many models might miss this shift due to language and entity dominance in their pipelines.
Imagine you’re relying on a model that processes sentiment from a variety of sources but doesn’t handle multilingual origin or entity dominance. Your model missed this by 23.3 hours, as indicated by the leading language of English, with a lag of 0.0 hours against the cluster. This structural gap could mean you’re late to catch significant shifts in sentiment, which can have major implications for decision-making.

English coverage led by 23.3 hours. Ca at T+23.3h. Confidence scores: English 0.95, Spanish 0.95, French 0.95 Source: Pulsebit /sentiment_by_lang.
To catch this momentum spike, we can leverage our API effectively. Below is a Python snippet that demonstrates how to query for sentiment data specifically around the topic of "software":
import requests
# Define the parameters for the API call
params = {
"topic": "software",
"score": +0.021,
"confidence": 0.95,
"momentum": -0.524,
"lang": "en" # Geographic origin filter
}
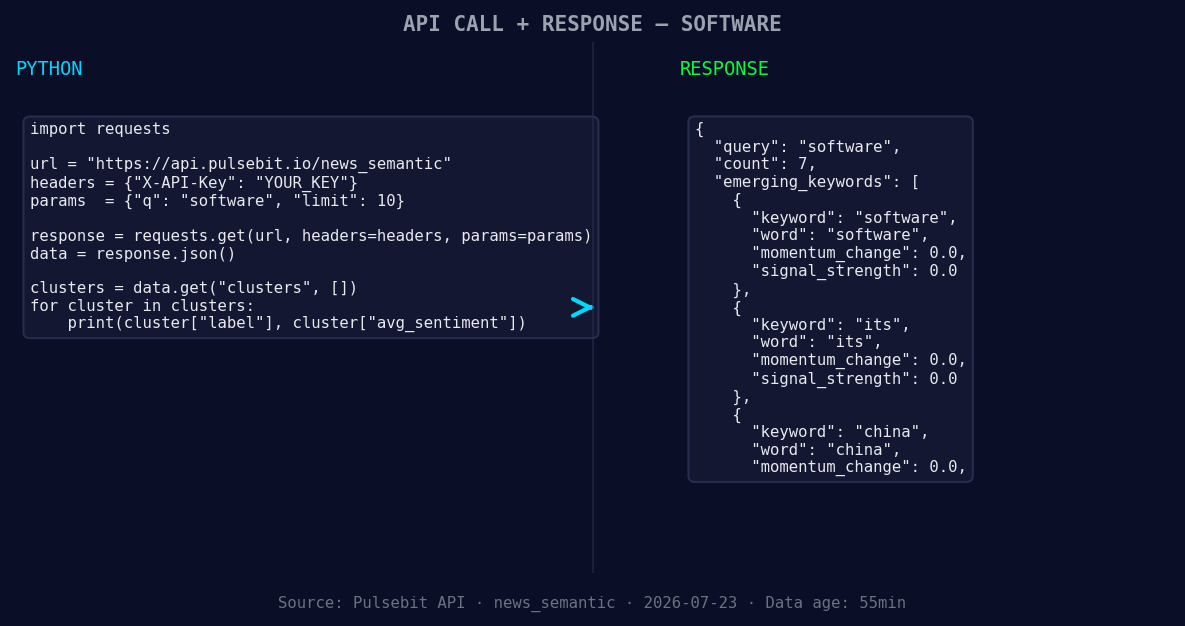
*Left: Python GET /news_semantic call for 'software'. Right: returned JSON response structure (clusters: 3). Source: Pulsebit /news_semantic.*
# Make the API call for sentiment data
response = requests.get('https://api.pulsebit.com/sentiment', params=params)
sentiment_data = response.json()
print(sentiment_data)
Next, we need to run the cluster reason string back through our sentiment endpoint to score the narrative framing itself. This is crucial for understanding the context behind the numbers. Here’s how you can do that:
# Define the cluster reason string
cluster_reason = "Clustered by shared themes: engineering, college, lab, ibm, software."

# Make the API call for meta-sentiment
meta_response = requests.post('https://api.pulsebit.com/sentiment', json={"text": cluster_reason})
meta_sentiment_data = meta_response.json()
print(meta_sentiment_data)
With these snippets, you're not just passively observing sentiment; you're actively engaging with it, ensuring that your models are catching the shifts in themes as they arise.
Now, let's talk about three specific builds you can implement with this pattern. First, consider setting a signal threshold for software sentiment that triggers alerts when momentum drops below -0.5. This will allow you to catch significant declines before they become widespread.
Second, leverage the geo filter by monitoring sentiment around “engineering” within a specific region. By implementing a geographic filter, you can pinpoint where sentiment shifts occur first.

Geographic detection output for software. India leads with 4 articles and sentiment +0.40. Source: Pulsebit /news_recent geographic fields.
Lastly, utilize the meta-sentiment loop to build a dashboard that visualizes the themes emerging from the clustering of articles. By monitoring the narratives around engineering, college, lab, and IBM, you’ll be able to track how these themes evolve over time, particularly in the context of forming gaps in software sentiment such as "software(+0.00), its(+0.00), china(+0.00)".
Get started by checking out our documentation at pulsebit.lojenterprise.com/docs. With these code snippets, you can copy-paste and run this in under 10 minutes, ensuring your pipeline catches those critical shifts in sentiment as they happen.


Top comments (0)