Your Pipeline Is 26.8h Behind: Catching Data Science Sentiment Leads with Pulsebit
We recently encountered an intriguing anomaly: a 24h momentum spike of -0.256 in the data science space. This spike emerged amidst a cluster of stories primarily from the Spanish press, led by a notable 26.8-hour lag. The driving narrative? “US Government Suspends Access to Anthropic Models.” This presents an opportunity to dig deeper into how our pipelines can better capture sentiment across multilingual sources, especially when significant developments unfold.

Spanish coverage led by 26.8 hours. Sl at T+26.8h. Confidence scores: Spanish 0.85, English 0.85, French 0.85 Source: Pulsebit /sentiment_by_lang.
The problem is clear: your model missed this by 26.8 hours. It’s easy to overlook critical insights when your pipeline lacks the ability to handle multilingual origins or entity dominance. The leading language in this scenario is Spanish, and by not accommodating for this diversity, you risk falling behind on emerging trends that could impact your decision-making.
Let’s look at how we can capture this sentiment spike programmatically. We can utilize our API to query relevant data and score the narrative around this anomaly. Here’s a snippet of Python code that will allow you to do just that:
import requests
# Step 1: Geographic origin filter - fetching data from Spanish sources
url = "https://api.pulsebit.com/sentiment"
params = {
"topic": "data science",
"lang": "sp"
}
response = requests.get(url, params=params)
data = response.json()
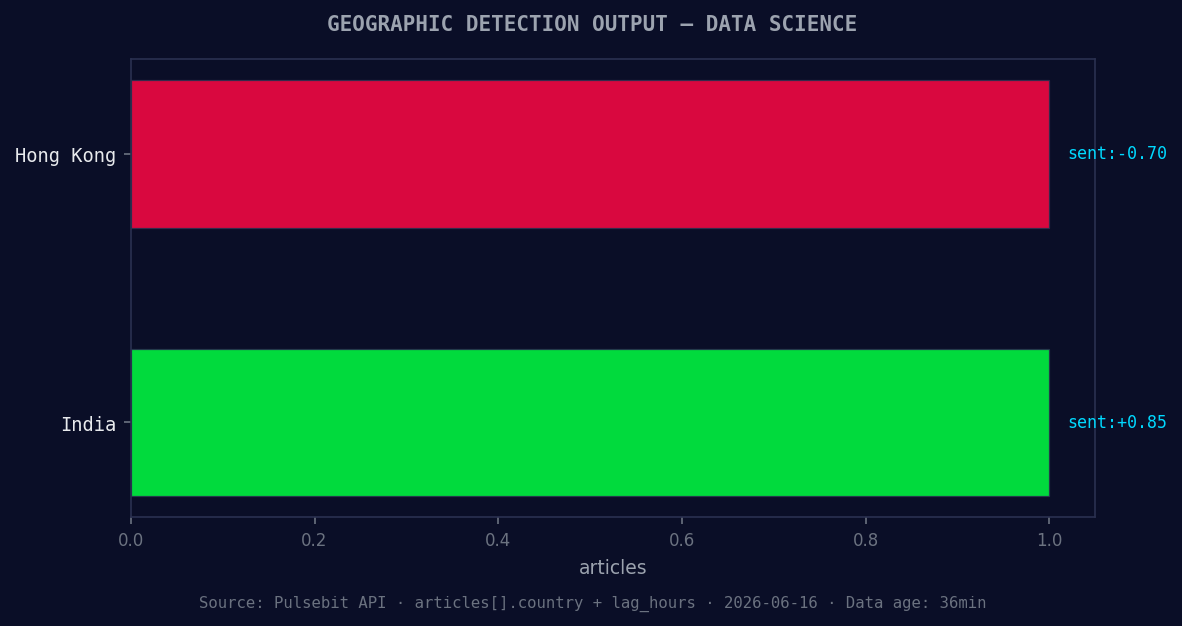
*Geographic detection output for data science. Hong Kong leads with 1 articles and sentiment -0.70. Source: Pulsebit /news_recent geographic fields.*
# Display the sentiment data
print(data)
# Step 2: Meta-sentiment moment - scoring the clustered narrative
cluster_reason = "Clustered by shared themes: oracle, champions, sustainable, responsible, global."
meta_sentiment_response = requests.post(url, json={"text": cluster_reason})
meta_sentiment = meta_sentiment_response.json()
# Output the meta sentiment result
print(meta_sentiment)
In the first step, we filter for Spanish language sources to capture the relevant articles. The API call retrieves sentiment data for the topic "data science." This allows us to remain focused on the emerging narrative surrounding significant events like the government’s suspension of access to Anthropic models.

Left: Python GET /news_semantic call for 'data science'. Right: returned JSON response structure (clusters: 3). Source: Pulsebit /news_semantic.
Next, we run the cluster reason string through our sentiment endpoint to evaluate how well the narrative framework aligns with the current sentiment. This insight is crucial as it helps us understand the underlying themes that are shaping public discourse.
Now, let's discuss three specific builds you can create based on this pattern:
Spanish Language Filtered Alerts: Implement an alert system that triggers when the 24h momentum drops below -0.3 for data science topics, specifically filtering for Spanish sources. This will ensure you stay updated on key developments from this demographic.
Meta-Sentiment Analysis Dashboard: Build a dashboard that visualizes the results from the meta-sentiment analysis, specifically focusing on narratives that cluster around terms like “oracle,” “champions,” and “sustainable.” Set thresholds to identify when the sentiment shifts significantly, allowing for proactive engagement.
Comparative Sentiment Trends: Create a comparative analysis tool that evaluates sentiment shifts in data science against mainstream narratives (like those of “oracle” or “champions”). Use a threshold of sentiment scores below +0.1 to identify when significant divergences appear, indicating potential market-moving insights.
By leveraging these insights, you can ensure your pipeline is not just reactive but also proactive, catching sentiment leads as they develop.
For more detailed instructions and examples, check out our documentation. You can copy-paste the provided code and run it in under 10 minutes, setting you on the path to enhanced sentiment awareness in your data science projects.

Top comments (0)