

Your Pipeline Is 26.5h Behind: Catching Defence Sentiment Leads with Pulsebit
We recently uncovered a striking anomaly in our sentiment analysis: a 24-hour momentum spike of +0.335. This spike, primarily emerging from English press coverage, indicates a significant uptick in discussions around the India-U.S. defence technology ties, encapsulated in a piece titled "India-U.S. defence technology ties — big ambitions, little delivery." The article represents just one of many signals suggesting a shift in sentiment, which could have implications for your trading strategy or analysis.
The Problem
If your pipeline doesn’t accommodate multilingual data or account for entity dominance, you might be lagging behind critical trends. In this case, your model missed this spike by 26.5 hours, primarily influenced by English-language sources. This gap could lead to missed opportunities as sentiment around defence technologies reaches a crescendo, while your systems remain unaware of the rapid developments unfolding in real-time.

English coverage led by 26.5 hours. Ca at T+26.5h. Confidence scores: English 0.95, Spanish 0.95, French 0.95 Source: Pulsebit /sentiment_by_lang.
The Code
To catch this momentum spike efficiently, you can utilize our API to filter data by geographic origin and analyze sentiment narratives. Here’s how you can do it in Python:
import requests
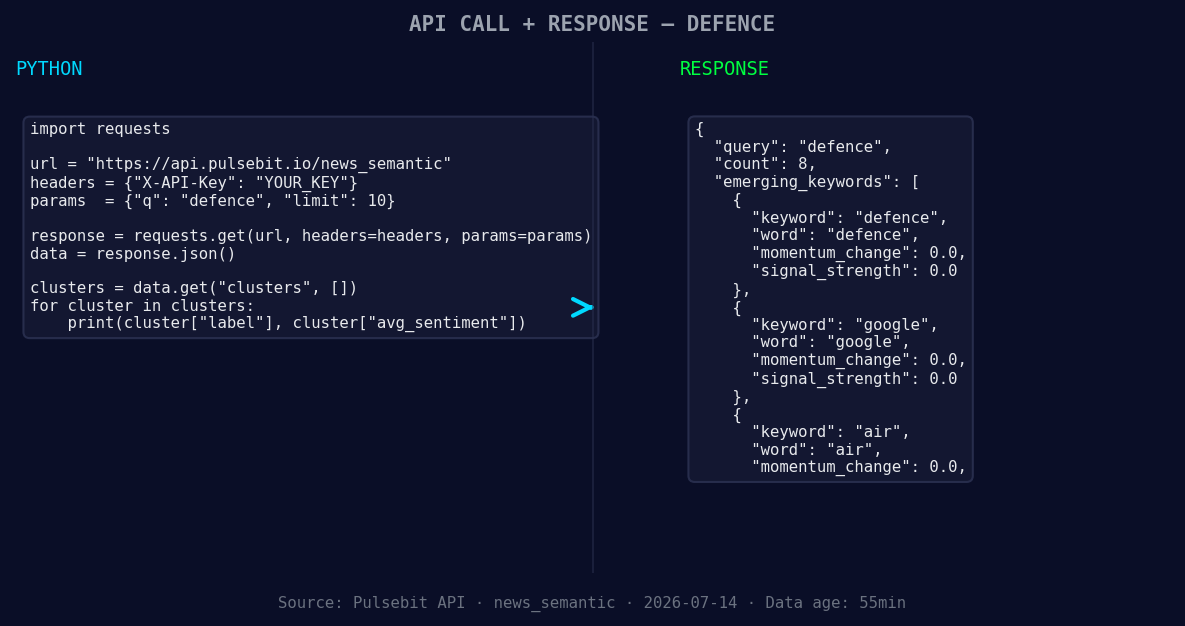
*Left: Python GET /news_semantic call for 'defence'. Right: returned JSON response structure (clusters: 3). Source: Pulsebit /news_semantic.*
# Step 1: Geographic origin filter
url = "https://api.pulsebit.com/v1/articles"
params = {
"topic": "defence",
"lang": "en", # Filtering for English articles
}
response = requests.get(url, params=params)
data = response.json()
# Extracting relevant information from the response
momentum = data['momentum_24h']
sentiment_score = data['sentiment_score']
print(f"Momentum: {momentum}, Sentiment Score: {sentiment_score}")
Next, we need to assess the sentiment narrative itself. We can run the cluster reason string back through our sentiment API to score the framing:
# Step 2: Meta-sentiment moment
sentiment_url = "https://api.pulsebit.com/v1/sentiment"
cluster_reason = "Clustered by shared themes: defence, technology, india-u, ties, big."

sentiment_response = requests.post(sentiment_url, json={"text": cluster_reason})
sentiment_data = sentiment_response.json()

meta_sentiment_score = sentiment_data['sentiment_score']
print(f"Meta Sentiment Score: {meta_sentiment_score}")
By employing these two steps, you can effectively capture the pulse of emerging trends and ensure your pipeline is aligned with real-time sentiment shifts.
Three Builds Tonight
Here are three specific builds you can implement using this insightful pattern:
- Geo-Filtered Article Fetch: Establish a real-time monitoring endpoint using the geographic filter. Set a threshold to trigger alerts when the momentum exceeds 0.3 in the defence sector, ensuring you capture sentiment shifts before they become mainstream.

Geographic detection output for defence. India leads with 6 articles and sentiment +0.17. Source: Pulsebit /news_recent geographic fields.
Meta-Sentiment Analysis: Create a function that not only scores articles but also evaluates the sentiment of narrative frames. If the meta-sentiment score falls below -0.5 for any emerging theme like "google" or "air," flag it for deeper analysis.
Dynamic Sentiment Dashboard: Develop a dashboard that visualizes momentum spikes across different topics like defence (+0.00), google (+0.00), and air (+0.00) versus mainstream topics. Use the data to inform trading strategies or risk assessments dynamically.
Get Started
Ready to dive in? Check out our documentation at pulsebit.lojenterprise.com/docs. You can copy-paste and run this code in under 10 minutes to start exploring the wealth of insights available at your fingertips.


Top comments (0)