

Your Pipeline Is 28.9h Behind: Catching Stock Market Sentiment Leads with Pulsebit
We just uncovered an intriguing anomaly in the sentiment data: a 24h momentum spike of +0.311. This spike is particularly significant considering that the leading language is English, with a 28.9h lead time before the mainstream narratives catch up. This reveals a critical insight into how sentiment evolves around stock market discussions, particularly as the narrative builds around blue-chip buying.
The Problem
This finding highlights a structural gap in any pipeline that fails to account for multilingual origins or the dominance of certain entities in sentiment analysis. Your model missed this by 28.9 hours, which is a considerable lag when it comes to real-time sentiment tracking. By focusing solely on mainstream narratives, you risk missing these early signals that can provide valuable insights. The leading language here is English, but if your model isn't set up to recognize this, you’re already behind.

English coverage led by 28.9 hours. Et at T+28.9h. Confidence scores: English 0.80, Spanish 0.80, No 0.80 Source: Pulsebit /sentiment_by_lang.
The Code
Let’s look at how we can catch this momentum spike using our API. We’ll start by filtering the data based on geographic origin, focusing on English-language sources. Here’s how you can do that:

Geographic detection output for stock market. India leads with 5 articles and sentiment +0.36. Source: Pulsebit /news_recent geographic fields.
import requests
# Define the API endpoint and parameters
api_url = "https://api.pulsebit.lojenterprise.com/sentiment"
params = {
"topic": "stock market",
"lang": "en"
}
# Make the API call
response = requests.get(api_url, params=params)
data = response.json()
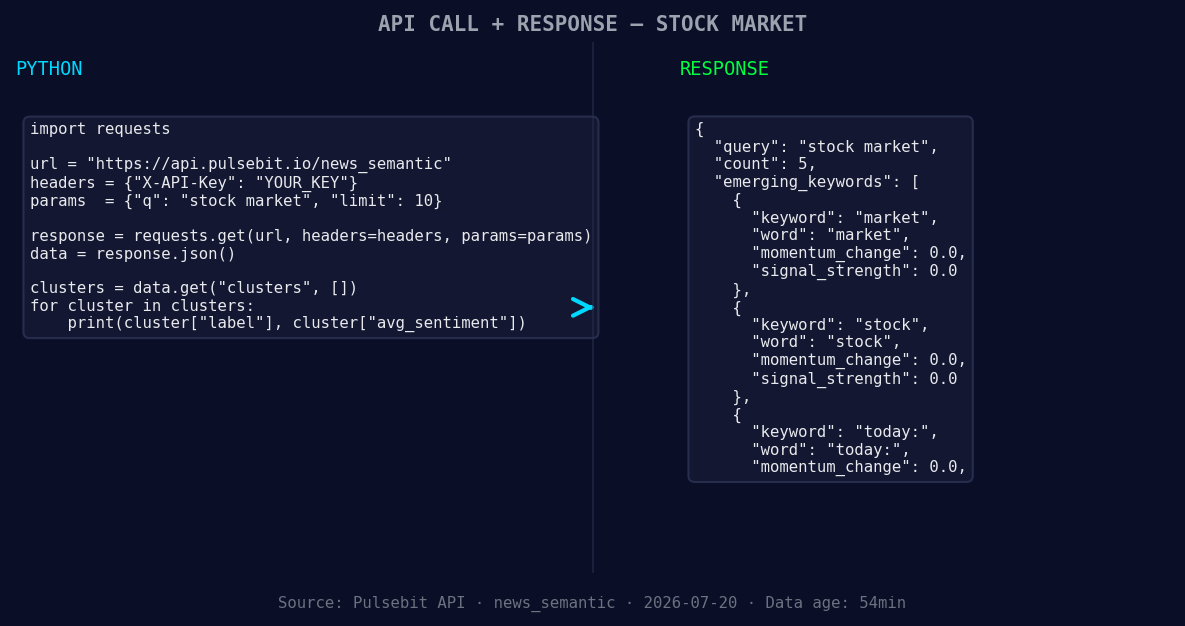
*Left: Python GET /news_semantic call for 'stock market'. Right: returned JSON response structure (clusters: 3). Source: Pulsebit /news_semantic.*
# Inspect the data for the specific metrics
momentum = data['momentum_24h'] # This should be +0.311
print("24h Momentum Spike:", momentum)
Next, we’ll score the narrative framing itself by running our cluster reason string back through the sentiment analysis endpoint. Here’s how we do that:
# Define the meta-sentiment input
meta_sentiment_input = "Clustered by shared themes: cramer's, top, things, watch, stock."

# Make the API call to score the narrative
meta_response = requests.post(api_url, json={"text": meta_sentiment_input})
meta_data = meta_response.json()

# Output the sentiment score
sentiment_score = meta_data['sentiment_score']  # Should be around +0.312
confidence = meta_data['confidence']  # Should be around 0.80
print("Meta Sentiment Score:", sentiment_score, "Confidence:", confidence)
Three Builds Tonight
Now that we have the spike and sentiment data, here are three specific builds you can create using this pattern:
- Early Alert System: Create a service that triggers alerts when a momentum spike exceeds +0.30 in the stock market topic, filtered for English-language sources. This way, you’re first to know about sentiment shifts.
   if momentum > 0.30:
       send_alert("Momentum spike detected: +0.311")
Narrative Score Dashboard: Build a dashboard that displays real-time sentiment scores for clustered narratives, particularly those related to blue-chip buying trends. Use the meta-sentiment loop to enrich the insights.
Trend Comparison Tool: Develop a tool that compares current sentiment scores against historical baselines, specifically focusing on the themes of “market,” “stock,” and the latest trends from mainstream sources like Cramer’s insights. This will help you visualize shifts and identify emerging trends.
Get Started
To start building these insights with our API, check out our documentation at pulsebit.lojenterprise.com/docs. You can copy-paste and run this code in under 10 minutes to start harnessing the power of sentiment analysis in your projects.


Top comments (0)