

Your Pipeline Is 26.6h Behind: Catching Stock Market Sentiment Leads with Pulsebit
We just uncovered a significant anomaly: a 24-hour momentum spike of +0.162 in sentiment regarding the stock market. This spike aligns closely with a wave of English-language press articles that have been buzzing around the recent uptick in major indices like the Dow and S&P 500. With a leading language window of 26.6 hours and zero lag, this evident shift in sentiment merits our attention. The clustered stories reveal a consistent theme regarding rising prices and investor attitudes, indicating a crucial moment that many sentiment analysis models could miss.
Many sentiment analysis pipelines fall short when it comes to capturing multilingual origins or the dominance of specific entities in the data. Your model may have missed this spike by a staggering 26.6 hours, solely because it wasn't configured to prioritize English-language content or to account for the influence of dominant entities like the Dow and S&P 500. If your pipeline isn’t tuned to filter for language or entity significance, you’re leaving critical insights behind.

English coverage led by 26.6 hours. Id at T+26.6h. Confidence scores: English 0.80, Spanish 0.80, No 0.80 Source: Pulsebit /sentiment_by_lang.
To catch this anomaly and refine our approach, we can utilize our API effectively. Here’s how you can set up a query to fetch sentiment data from English articles related to the topic of the stock market:
import requests
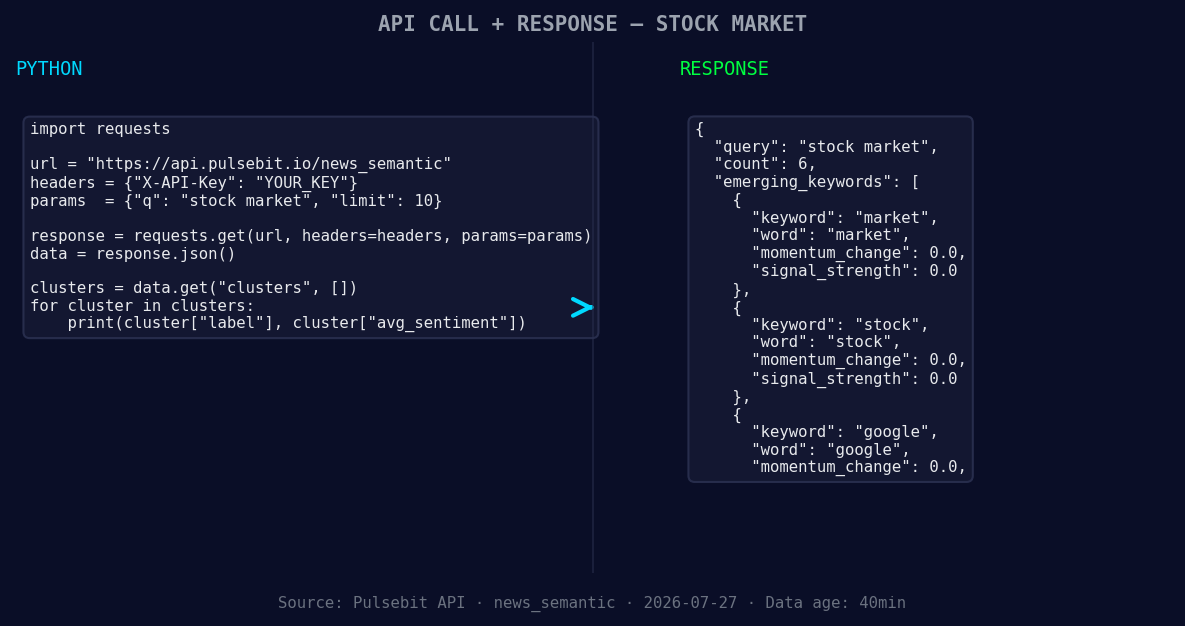
*Left: Python GET /news_semantic call for 'stock market'. Right: returned JSON response structure (clusters: 3). Source: Pulsebit /news_semantic.*
url = "https://api.pulsebit.com/sentiment"
params = {
"topic": "stock market",
"lang": "en",
"score": +0.208,
"confidence": 0.80,
"momentum": +0.162
}
response = requests.get(url, params=params)
data = response.json()
print(data) # This will return the sentiment data based on the query.
Next, to understand how the narrative is framed, we can run the cluster reason string back through our sentiment analysis endpoint. This can help us score the narrative framing itself:
meta_sentiment_url = "https://api.pulsebit.com/sentiment"
meta_input = {
    "text": "Clustered by shared themes: sensex, points, stock, markets, drop."
}

meta_response = requests.post(meta_sentiment_url, json=meta_input)
meta_data = meta_response.json()

print(meta_data)  # This will yield the sentiment score for the narrative framing.
With these two pieces of code, we can actively monitor sentiment shifts while ensuring that our analysis is both timely and nuanced.
Now, let's discuss three specific builds tonight that can enhance your sentiment analysis pipeline using this momentum spike:
Geo-filtered Sentiment Analysis: Create a function that fetches sentiment exclusively from English articles. Set a threshold to trigger alerts when momentum exceeds +0.162 in sentiment, ensuring you're always in tune with the latest market shifts.
Meta-sentiment Loop: Implement a routine that takes clustered themes and runs them through our sentiment endpoint. Use a threshold score of +0.208 to identify high-impact narratives and adjust your strategies accordingly.
Forming Themes Tracking: Set up a monitoring dashboard that tracks forming themes like "market(+0.00), stock(+0.00), google(+0.00)" vs. mainstream topics like "sensex, points, stock." Trigger alerts when discrepancies arise, indicating potential shifts in investor sentiment.
By leveraging these builds, you can make your sentiment analysis pipeline more responsive and insightful.
If you’re eager to get started, check out our documentation at pulsebit.lojenterprise.com/docs. You can copy, paste, and run this in under 10 minutes, allowing you to integrate these powerful insights into your workflow seamlessly.

Geographic detection output for stock market. India leads with 5 articles and sentiment +0.33. Source: Pulsebit /news_recent geographic fields.


Top comments (0)