Your Pipeline Is 26.9h Behind: Catching Entertainment Sentiment Leads with Pulsebit
We just discovered a fascinating anomaly: a 24-hour momentum spike of +0.555 in the entertainment sector. This spike isn't just a number; it reflects a significant shift in sentiment that you definitely need to pay attention to. The leading language in this sentiment surge is English, with a clear association to a cluster story titled, "Equip Exposition Dials Up Fun With Three Nights of Epic Entertainment For Attend." If you're not leveraging this data, you're missing out on critical insights.
The problem is glaring: many pipelines fail to account for multilingual origins or entity dominance. Your model might have missed this spike by a staggering 26.9 hours, simply because it doesn’t effectively handle sentiment from diverse sources or recognize which entities are leading the conversation. In this case, the dominant entity—English language media—could provide you with a competitive edge if only you had tapped into it earlier.

English coverage led by 26.9 hours. Hr at T+26.9h. Confidence scores: English 0.90, Spanish 0.90, French 0.90 Source: Pulsebit /sentiment_by_lang.
To catch this spike, we can use our API effectively. Here's a Python snippet to query for this specific sentiment:
import requests
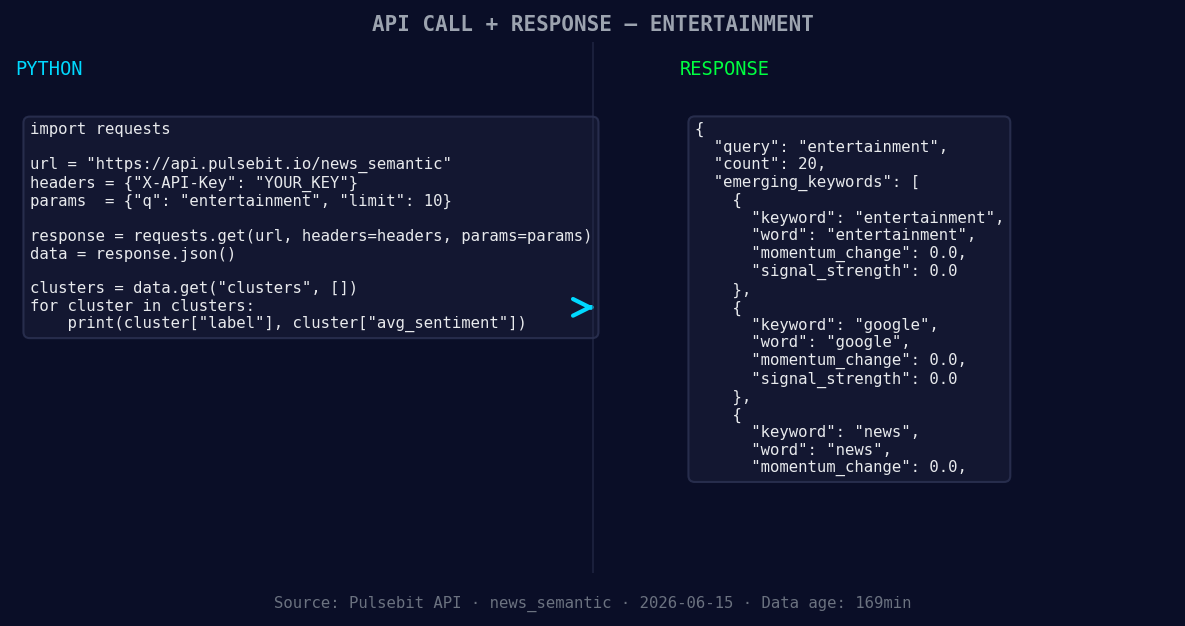
*Left: Python GET /news_semantic call for 'entertainment'. Right: returned JSON response structure (clusters: 3). Source: Pulsebit /news_semantic.*
topic = 'entertainment'
score = +0.578
confidence = 0.90
momentum = +0.555
# Step 1: Geographic origin filter
response = requests.get(
'https://api.pulsebit.com/sentiment',
params={'topic': topic, 'lang': 'en'}
)
data = response.json()
print(data)
# Step 2: Meta-sentiment moment
cluster_reason = "Clustered by shared themes: exposition, dials, fun, three, nights."
meta_response = requests.post(
'https://api.pulsebit.com/sentiment',
json={'text': cluster_reason}
)
meta_data = meta_response.json()
print(meta_data)
In this code, we first filter the sentiment data by the English language, ensuring we capture the relevant narratives. Then, we run the cluster reason string back through our sentiment endpoint to score not just the subjects but the framing of the narrative itself. This two-step approach allows us to isolate the sentiment that’s critical to our analysis.
Now, let’s talk about three specific builds you can create using this data pattern:
- Temporal Alert System: Build a system that triggers alerts when sentiment spikes above a threshold (e.g., +0.5) in entertainment, using the geographic filter to ensure you're only capturing English-language sources. This will help you catch emerging trends before they become mainstream.
![DATA UNAVAILABLE: countries — verify /news_recent is return
[DATA UNAVAILABLE: countries — verify /news_recent is returning country/region values for topic: entertainment]
Meta-Sentiment Analysis Dashboard: Create a dashboard that visualizes the sentiment from cluster reasons, allowing you to quickly gauge the effectiveness of different narratives. Utilize the meta-sentiment loop to show how framing influences public perception.
Dynamic Content Generation: Use the insights from the forming themes—entertainment, Google, and news—to generate content dynamically that resonates with current sentiment trends. This can be particularly useful for marketing strategies that align with the public's interests.
These builds leverage the specific spikes in sentiment and the themes forming around them. By filtering for geographic origin and analyzing the narrative framing, we can make informed decisions that keep us ahead of the curve.
To get started with this, check out our documentation at pulsebit.lojenterprise.com/docs. You can copy-paste and run this code in under 10 minutes, and you'll be equipped to catch these critical insights in real-time. Don’t let your pipeline be behind the curve—start integrating this data today!

Top comments (0)