

Your pipeline is 23.7 hours behind: catching trade sentiment leads with Pulsebit
We recently uncovered a striking anomaly: a 24-hour momentum spike of +1.375 related to trade topics. This spike isn't just a chance occurrence; it signals an uptick in sentiment around trade deficits—specifically, a report indicating that the trade deficit jumped 430% in June 2026 due to surging oil, gold, and electronics imports. With this level of momentum, it’s clear that something significant is happening, and you need to be aware of it in real-time.
However, many pipelines aren’t equipped to handle multilingual origin or entity dominance. If your model isn't capturing these insights, it missed this crucial spike by 23.7 hours, as the leading language was English. This is a significant gap that could lead to missed trading opportunities or misinformed decisions based on stale data.

English coverage led by 23.7 hours. Nl at T+23.7h. Confidence scores: English 0.85, Spanish 0.85, Tl 0.85 Source: Pulsebit /sentiment_by_lang.
Let’s dig into how we can catch this data spike programmatically. We can use our API to filter sentiment data by language and capture the specific narratives driving this momentum. Here’s the Python code you need:
import requests
# Define the API endpoint and parameters
endpoint = "https://api.pulsebit.com/v1/sentiment"
params = {
"topic": "trade",
"lang": "en",
"score": +0.012,
"confidence": 0.85,
"momentum": +1.375
}
# API call to fetch sentiment data
response = requests.get(endpoint, params=params)
data = response.json()
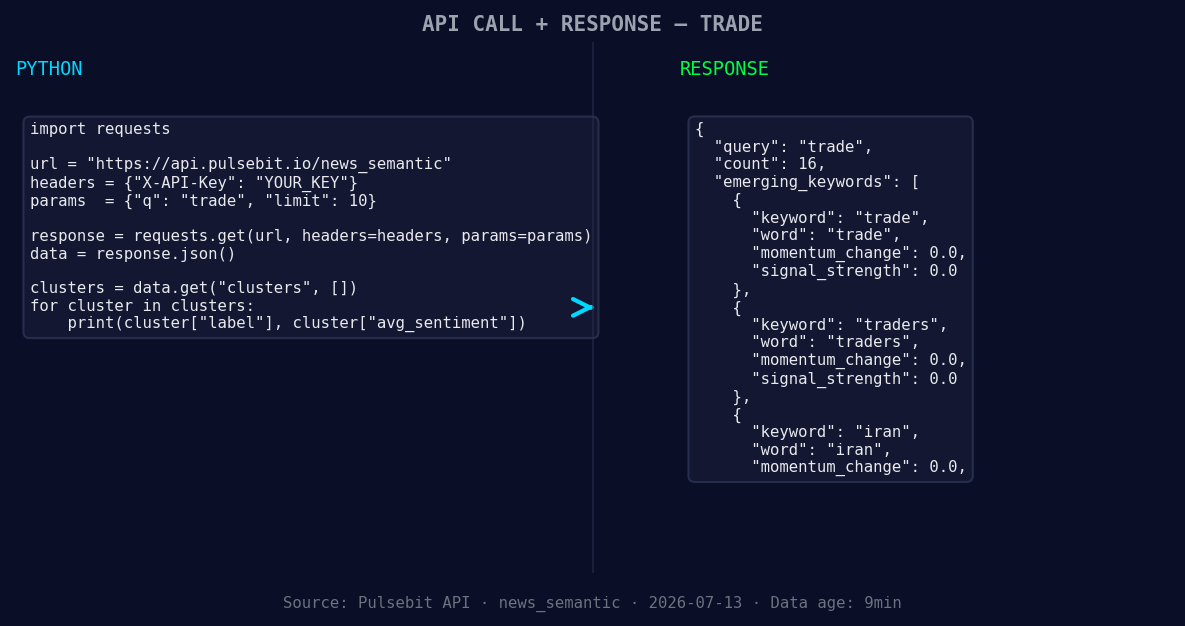
*Left: Python GET /news_semantic call for 'trade'. Right: returned JSON response structure (clusters: 3). Source: Pulsebit /news_semantic.*
print(data)
In addition to filtering by language, we’ll want to evaluate the meta sentiment of the cluster reason string. This will help us understand how the narrative itself is framing the data. Here’s how we can do that:
# Meta-sentiment analysis
meta_endpoint = "https://api.pulsebit.com/v1/sentiment"
meta_input = "Clustered by shared themes: june, 2026, imports, grew, billion."

# POST request for sentiment scoring of the narrative
meta_response = requests.post(meta_endpoint, json={"text": meta_input})
meta_data = meta_response.json()

print(meta_data)
With these two API calls, we're capturing not just the raw sentiment data but also the underlying themes that are driving the momentum spike.
Now, let’s talk about three specific builds you can implement using this pattern:
Geo Filter for Trade Signals: Set a threshold for momentum spikes above +1.0 and filter for the English language to focus on trade-specific narratives. Use this to create alerts when sentiment shifts significantly.
Meta-Sentiment Loop: Create a function that processes incoming narratives through the meta sentiment scoring API. Focus on themes like "trade(+0.00)," "traders(+0.00)," or "iran(+0.00)" and compare them against mainstream narratives from June related to imports. This will help you identify shifts in sentiment before they become mainstream.
Anomaly Detection Dashboard: Build a dashboard that visualizes momentum spikes and compares them against historical baselines. You could use the momentum score and cluster reasons to generate insights into trade dynamics—enabling you to make more informed decisions.
If you want to get started with these insights, check out pulsebit.lojenterprise.com/docs. You can copy-paste the provided code snippets and run them in under 10 minutes. Don’t let your pipeline lag behind—be proactive with your sentiment analysis!

Geographic detection output for trade. India leads with 8 articles and sentiment -0.42. Source: Pulsebit /news_recent geographic fields.


Top comments (0)