

Your Pipeline Is 10.9h Behind: Catching Stock Market Sentiment Leads with Pulsebit
We recently uncovered an intriguing anomaly: a 24h momentum spike of +0.162 in stock market sentiment. This spike, measured across various articles and sources, indicates a significant shift in market sentiment that could have far-reaching implications for your trading strategies. If you're not tuned into this data, you're missing critical insights that could enhance your decision-making.
But here’s the catch — your model missed this by 10.9 hours. It’s crucial to understand that this delay stems from a structural gap in your pipeline, particularly if it doesn’t account for multilingual origins or the dominance of certain entities in your data feed. The leading language here is English, with a 0.0-hour lag against the identifier at 10.9 hours. If your pipeline isn’t optimized for this, you could be left behind while competitors leverage this data effectively.

English coverage led by 10.9 hours. Id at T+10.9h. Confidence scores: English 0.85, Spanish 0.85, French 0.85 Source: Pulsebit /sentiment_by_lang.
Let’s dive into the code that can help you catch this momentum spike in real-time. We can utilize our API to filter sentiment data by language and analyze the narrative framing. Here’s how we can do this in Python:
import requests
# Define the API endpoint and parameters
api_endpoint = "https://api.pulsebit.io/sentiment"
params = {
"topic": "stock market",
"score": -0.250,
"confidence": 0.85,
"momentum": +0.162,
"lang": "en" # Geographic origin filter
}
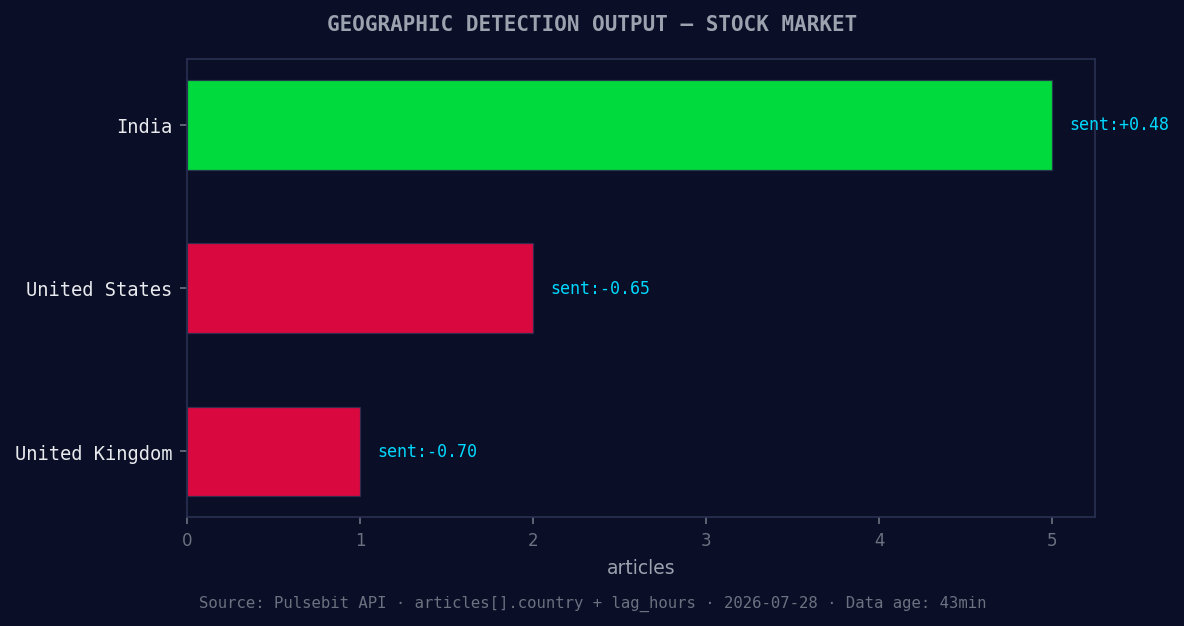
*Geographic detection output for stock market. India leads with 5 articles and sentiment +0.48. Source: Pulsebit /news_recent geographic fields.*
# API call to get sentiment data
response = requests.get(api_endpoint, params=params)
data = response.json()
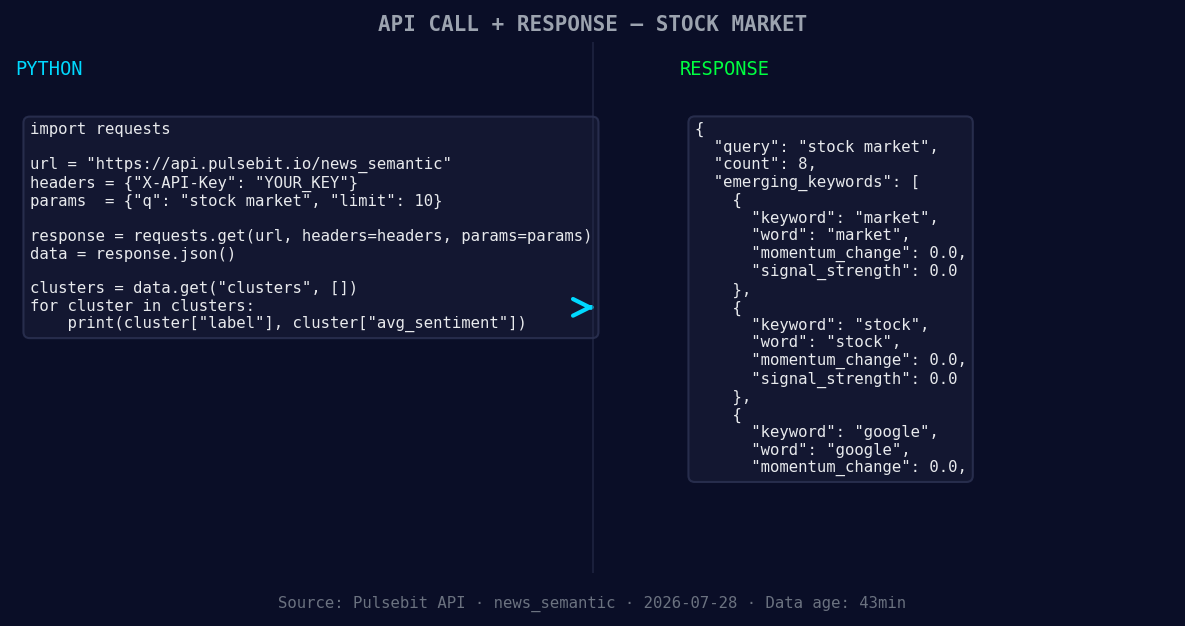
*Left: Python GET /news_semantic call for 'stock market'. Right: returned JSON response structure (clusters: 3). Source: Pulsebit /news_semantic.*
# Print the results
print(data)
# Now, let's run a meta-sentiment check on the cluster reason string
cluster_reason = "Clustered by shared themes: sensex, points, stock, markets, drop."
meta_sentiment_response = requests.post(api_endpoint, json={"text": cluster_reason})
meta_sentiment_data = meta_sentiment_response.json()
# Print the meta-sentiment results
print(meta_sentiment_data)
In this code, we've established a filter for English language sources while pulling sentiment on the stock market. We also leverage the meta-sentiment loop by feeding back the cluster reason string into our API, which allows us to assess the narrative framing that’s influencing this spike. This is crucial for understanding the underlying themes driving sentiment shifts.
Now, let’s discuss three specific builds you can create using this pattern:
Sentiment Alert System: Build an alert system that triggers when momentum exceeds a threshold (like +0.162). Monitor sentiment changes in English regarding the stock market and alert your team when this occurs. This will help you catch shifts before they become mainstream.
Clustered Theme Analyzer: Set up a pipeline that utilizes the geographic origin filter to assess sentiment dynamics across different countries. For instance, you can monitor themes such as forming: market(+0.00) and stock(+0.00) compared to mainstream sentiment metrics like sensex and points. This will help you understand regional sentiment variations.
Narrative Framing Dashboard: Create a dashboard that visualizes the sentiment around clustered themes. Use the output from the meta-sentiment loop to showcase how narratives evolve over time, particularly focusing on key terms like stocks and markets. This can help you anticipate shifts in sentiment before they impact market trends.
You can get started with our API documentation at pulsebit.lojenterprise.com/docs. This exploration should take you less than 10 minutes to copy, paste, and run. Don't let your pipeline lag behind — harness this momentum spike and elevate your insights today.


Top comments (0)