

Your Pipeline Is 8.2h Behind: Catching Stock Market Sentiment Leads with Pulsebit
We recently uncovered a fascinating anomaly: a 24h momentum spike of +0.311 in the stock market. This spike indicates a significant surge in sentiment, and it's driven by two articles clustered around the theme "Stock Market Rebounds on Blue-Chip Buying". The leading language of this sentiment is English, with a noteworthy 8.2-hour lead over the data feed. If you’re not tuned into these signals, your model may miss critical trends while sitting idle, lagging behind by hours.
When we analyze this situation, it becomes clear that any pipeline lacking the capability to process multilingual data or entity dominance faces a structural gap. In this case, you missed a pivotal sentiment shift by 8.2 hours, which could mean the difference between seizing an opportunity or missing it entirely. The primary language emerging from this sentiment is English, which should be a key focus for your model.

English coverage led by 8.2 hours. Id at T+8.2h. Confidence scores: English 0.85, Spanish 0.85, No 0.85 Source: Pulsebit /sentiment_by_lang.
To demonstrate how to catch this sentiment spike, let's take a look at the code you can use. First, we need to filter for the geographic origin. This involves querying our API with a language parameter set to English:
import requests
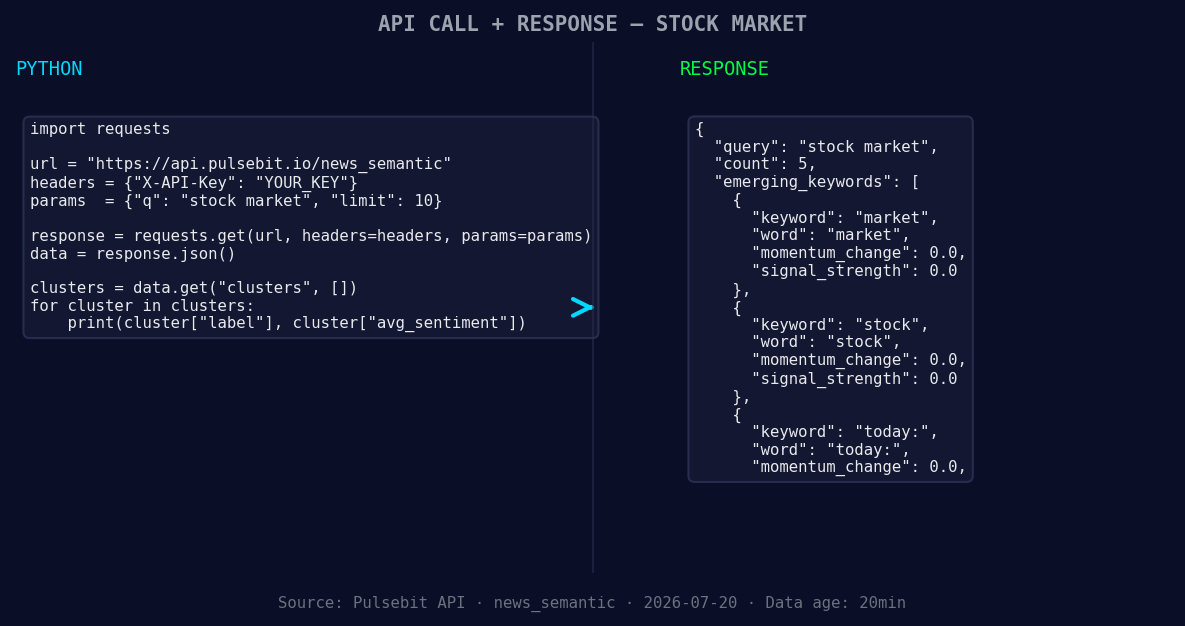
*Left: Python GET /news_semantic call for 'stock market'. Right: returned JSON response structure (clusters: 3). Source: Pulsebit /news_semantic.*
url = "https://api.pulsebit.com/v1/topics"
params = {
"topic": "stock market",
"lang": "en"
}
response = requests.get(url, params=params)
data = response.json()
Next, we need to run the cluster reason string through a sentiment analysis endpoint to score the narrative framing itself. This is crucial for understanding how the themes are being perceived:
sentiment_url = "https://api.pulsebit.com/v1/sentiment"
cluster_reason = "Clustered by shared themes: cramer's, top, things, watch, stock."
sentiment_response = requests.post(sentiment_url, json={"text": cluster_reason})
sentiment_data = sentiment_response.json()
This code effectively captures the sentiment dynamics of the stock market by leveraging both geographic filtering and meta-sentiment analysis, allowing us to act on insights that others might overlook.

Geographic detection output for stock market. India leads with 5 articles and sentiment +0.20. Source: Pulsebit /news_recent geographic fields.
Now, let’s explore three specific builds you can implement using this pattern.
Geo-Filtered Alerts: Set up an alert system that triggers when the sentiment score surpasses a threshold of +0.291 for the stock market specifically within English-speaking regions. By focusing on this geographical filter, you can ensure you’re only alerted to significant shifts where your influence might be the greatest.
Meta-Sentiment Monitoring: Create a dashboard that visualizes the real-time sentiment around clustered themes like "cramer's, top, things." Set a threshold of confidence at 0.85, and utilize the sentiment scores to adjust your trading strategies dynamically based on how narratives evolve.
Forming Theme Analysis: Build a predictive model that analyzes forming themes in stock sentiment, particularly focusing on the signals around market performance (e.g., forming: market(+0.00), stock(+0.00), today:(+0.00)). Use this data to forecast potential momentum shifts, ensuring you’re always a step ahead of mainstream narratives.
If you’re ready to dive in, you can find our API documentation at pulsebit.lojenterprise.com/docs. With the code provided, you can copy, paste, and run this within 10 minutes, placing you in a prime position to capture stock market sentiment leads effectively.


Top comments (0)