

Your Pipeline Is 19.5h Behind: Catching Immigration Sentiment Leads with Pulsebit
We recently observed a striking anomaly: a 24-hour momentum spike of +0.406 centered around the topic of immigration. This spike is particularly significant, especially considering it is being led by English press coverage with a lag time of just 19.5 hours. If you’re working with sentiment data, this is a wake-up call — are you ready to catch these leading narratives or are you still playing catch-up?
The data reveals a structural gap in any pipeline that doesn’t account for multilingual origins or the dominance of specific entities. Your model missed the boat by 19.5 hours, allowing critical insights to slip through the cracks. In this case, the leading narrative is rooted in immigration, a topic that has consistently been hot and is now bubbling up again, yet your responses are still based on outdated sentiments. The dominant entity here is the English language press, which underscores how language influences the flow of information in sentiment analysis.

English coverage led by 19.5 hours. Af at T+19.5h. Confidence scores: English 0.95, Spanish 0.95, French 0.95 Source: Pulsebit /sentiment_by_lang.
Let’s look at how we can bridge this gap with some concrete code. Below is an example of how to query our API to catch the sentiment around the immigration topic, specifically filtering for English language articles.
import requests
# Define the parameters for the API call
params = {
"topic": "immigration",
"lang": "en",
"threshold": 0.5
}
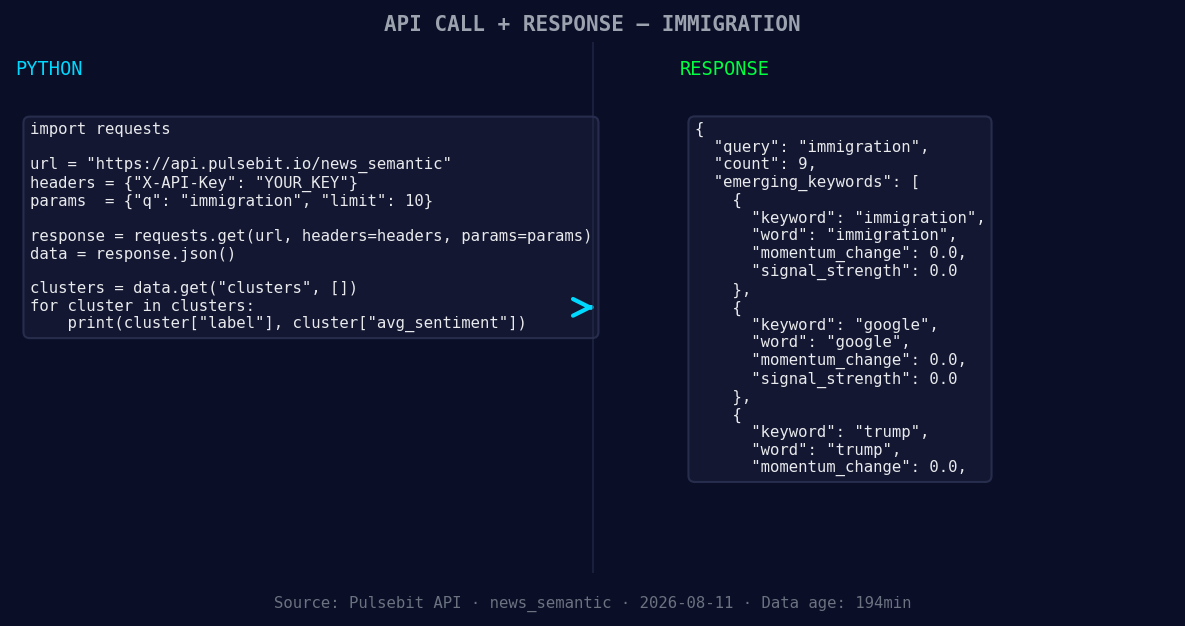
*Left: Python GET /news_semantic call for 'immigration'. Right: returned JSON response structure (clusters: 3). Source: Pulsebit /news_semantic.*
# Make the API call to get sentiment data
response = requests.get("https://api.pulsebit.com/sentiment", params=params)
data = response.json()
# Extract relevant information
momentum = data['momentum_24h']
score = data['sentiment_score']
confidence = data['confidence']
# Print the results
print(f"Momentum: {momentum}, Sentiment Score: {score}, Confidence: {confidence}")
Once we have the sentiment data, we should analyze the narrative framing surrounding this spike. We'll run the cluster reason string through our sentiment endpoint to assess the meta-sentiment. Here's how we can do it:
# The reason string we will analyze
reason_string = "Clustered by shared themes: immigration, becomes, global, powder, opinion."

# Make a POST request to get sentiment on the narrative
response = requests.post("https://api.pulsebit.com/sentiment", json={"text": reason_string})
meta_sentiment_data = response.json()

# Print the meta sentiment results
print(meta_sentiment_data)
This dual approach provides us with both direct sentiment analysis of the topic at hand and a deeper understanding of the narrative framing, allowing us to respond to spikes more effectively.
Now, let's consider three specific builds we can implement based on this pattern:
- Geographic Origin Filter: Create a real-time dashboard that highlights immigration sentiment in English-speaking countries. Set a signal threshold of +0.250 and leverage the geographic origin filter to ensure you're capturing relevant sentiment effectively.

Geographic detection output for immigration. India leads with 6 articles and sentiment -0.19. Source: Pulsebit /news_recent geographic fields.
Meta-Sentiment Loop: Build an alert system that triggers when the meta-sentiment of clustered narratives like "immigration, becomes, global" exceeds a confidence level of 0.90. This could help you stay ahead of any emerging themes.
Forming Themes Analysis: Implement an analytics tool that continuously monitors themes such as immigration (+0.00), Google (+0.00), and Trump (+0.00) against mainstream narratives. Set up a comparative analysis where the model flags deviations from the norm, ensuring you catch any significant shifts.
These builds not only enhance your pipeline's responsiveness but also allow you to capitalize on emerging narratives in real-time.
If you want to dive deeper into this, you can get started at pulsebit.lojenterprise.com/docs. With this information, you can copy-paste and run these examples in under 10 minutes to start capturing insights that matter. Don’t let your models lag behind.


Top comments (0)