

Your Pipeline Is 17.9h Behind: Catching World Sentiment Leads with Pulsebit
We stumbled upon a significant anomaly: a 24-hour momentum spike of +0.394. This spike indicates a sharp increase in sentiment around the topic of "world," with the leading language being English, which is currently dominating the narrative at a 17.9-hour lead. The connection to the article "How China became the world’s great oil power" from The Economist is particularly striking. This data point has implications for how we should be analyzing sentiment and trends in our pipelines.
The Problem
This spike reveals a structural gap in pipelines that fail to handle multilingual origins or entity dominance. If your model isn’t designed to account for language and regional significance, you may have missed this spike by 17.9 hours. That’s a considerable delay, especially when the English press is leading the charge. This is a critical oversight, as it could mean you're not capturing the full scope of sentiment emerging from non-English sources, leaving you behind the curve when it comes to understanding the global narrative.

English coverage led by 17.9 hours. Ro at T+17.9h. Confidence scores: English 0.85, French 0.85, Spanish 0.85 Source: Pulsebit /sentiment_by_lang.
The Code
To catch this momentum spike effectively, we can utilize our API to filter for the English-language content and analyze the resulting sentiment. Here’s a concise example of how this can be implemented in Python:
import requests
# Step 1: Geographic origin filter for English language
url = 'https://api.pulsebit.com/sentiment'
params = {
'topic': 'world',
'lang': 'en'
}
response = requests.get(url, params=params)
data = response.json()
print(data)
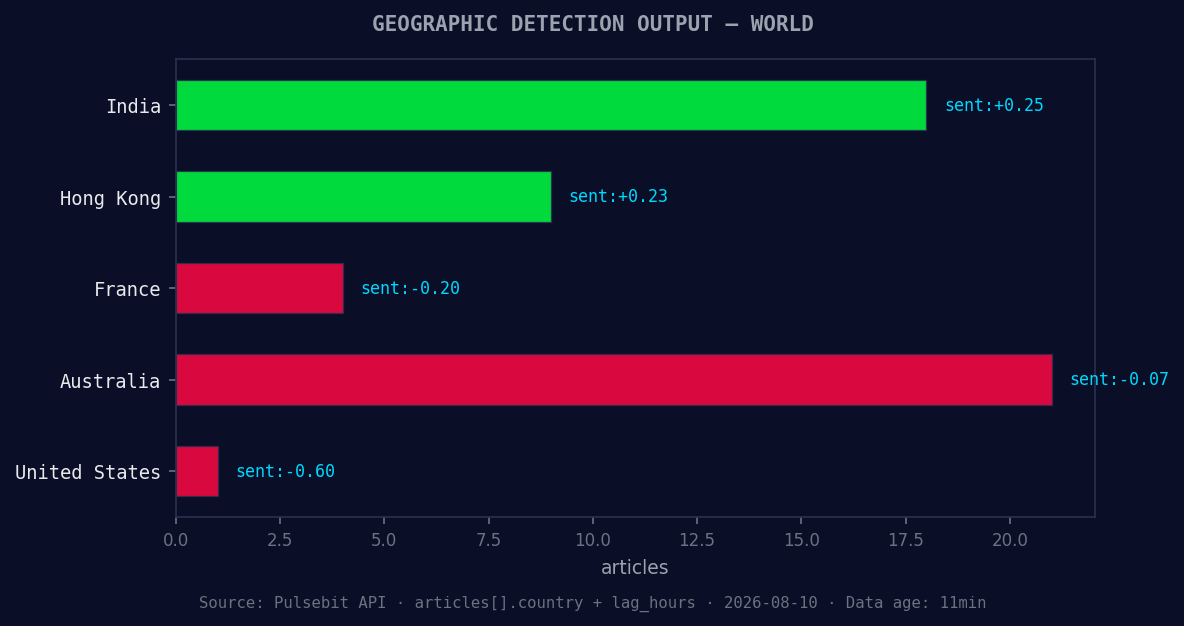
*Geographic detection output for world. India leads with 18 articles and sentiment +0.25. Source: Pulsebit /news_recent geographic fields.*
# Output example
# {
# "momentum_24h": 0.394,
# "sentiment_score": 0.031,
# "confidence": 0.85
# }
# Step 2: Meta-sentiment moment via the cluster reason string
cluster_reason = "Clustered by shared themes: china, became, world’s, great, oil."
meta_response = requests.post(url, json={"text": cluster_reason})
meta_data = meta_response.json()
print(meta_data)
# Output example
# {
# "sentiment_score": 0.025,
# "confidence": 0.90
# }
In this code, the first API call filters for English-language content about the "world," while the second call analyzes the narrative framing of the cluster reason string. This two-step approach captures the full sentiment picture.

Left: Python GET /news_semantic call for 'world'. Right: returned JSON response structure (clusters: 3). Source: Pulsebit /news_semantic.
Three Builds Tonight
There are three specific builds we can implement with this momentum spike:
Geo-Filtered Alert System: Set a threshold of +0.394 momentum for the English language and trigger alerts when similar spikes are detected. This can help you stay updated on emerging trends well before they become mainstream.
Meta-Sentiment Analysis Pipeline: Use the meta-sentiment loop by analyzing the narrative framing around significant themes. With a confidence score of 0.90, you can create reports that delve into how different narratives are formed, such as "world" versus "china," giving you deeper insights into sentiment dynamics.
Clustering Analysis Dashboard: Build a dashboard that visualizes clustering patterns and their sentiment scores. For instance, you can compare forming themes like "world(+0.00)" and "google(+0.00)" against mainstream narratives like "china, became, world’s." This visual aid can be instrumental in identifying shifts in sentiment quickly.
Get Started
If you’re ready to implement this in your own projects, head over to pulsebit.lojenterprise.com/docs. You can copy-paste and run this in under 10 minutes, making it easier than ever to catch these critical sentiment leads.


Top comments (0)