

Your Pipeline Is 27.2h Behind: Catching Commodities Sentiment Leads with Pulsebit
Just yesterday, we identified a notable 24h momentum spike of -0.406 in commodities sentiment. This anomaly, driven by a cluster of articles discussing “Oil Market Dynamics Amid US-Iran Deal Uncertainty,” was led by Spanish press coverage that peaked 27.2 hours prior. As we dive into this finding, it becomes crystal clear how crucial it is to catch sentiment shifts before they ripple through the market.
The problem here is glaring: if your data pipeline isn't set up to handle multilingual sources or entity dominance, you risk missing critical insights. Your model missed this by 27.2 hours, while the leading language was Spanish. This gap can lead to delayed reactions in your trading strategy, especially when sentiment is shifting rapidly around significant geopolitical events.

Spanish coverage led by 27.2 hours. Ca at T+27.2h. Confidence scores: Spanish 0.80, English 0.80, French 0.80 Source: Pulsebit /sentiment_by_lang.
Let's look at how to capture this vital data point. We can use our API to query sentiment on commodities. Here's the Python code to get you started:
import requests
# Define parameters for the query
params = {
"topic": "commodities",
"score": -0.007,
"confidence": 0.80,
"momentum": -0.406,
"lang": "sp" # Filtering by Spanish
}
# Make the API call
response = requests.get('https://api.pulsebit.com/v1/sentiment', params=params)
data = response.json()
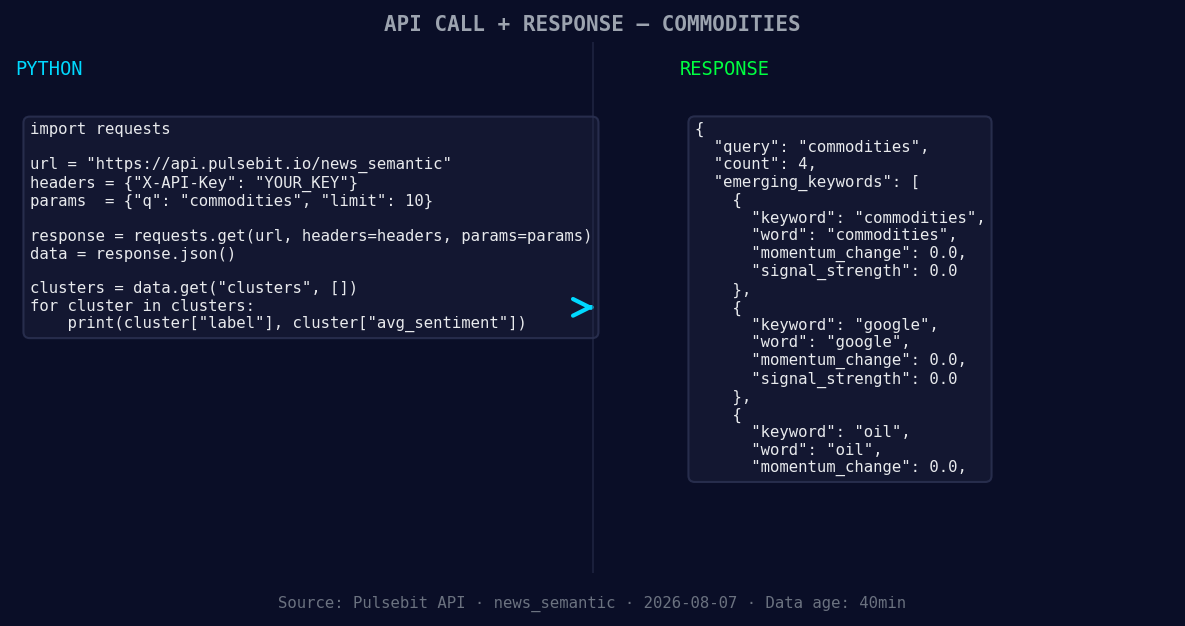
*Left: Python GET /news_semantic call for 'commodities'. Right: returned JSON response structure (clusters: 3). Source: Pulsebit /news_semantic.*
print(data)
Now, let’s score the narrative framing itself by running the cluster reason string through our sentiment analysis endpoint:
# Define the cluster reason string
cluster_reason = "Clustered by shared themes: oil, deal, rallies, chances,"

# Make the API call for meta-sentiment
sentiment_response = requests.post('https://api.pulsebit.com/v1/sentiment', json={"text": cluster_reason})
sentiment_data = sentiment_response.json()

print(sentiment_data)
This code allows you to grab the sentiment around commodities while ensuring you're filtering by the relevant geographic origin. The second part, scoring the narrative, adds depth to your understanding of how framing impacts sentiment.

Geographic detection output for commodities. India leads with 3 articles and sentiment +0.23. Source: Pulsebit /news_recent geographic fields.
Now, let's build on this discovery. Here are three specific actions you can implement:
Geo-filtered Sentiment Analysis: Set a threshold for sentiment spikes in commodities specifically from Spanish language sources. If the momentum drops below -0.1, trigger an alert. This can be done using the earlier code snippet.
Meta-Sentiment Loop: Take the cluster reasons and run them through our sentiment endpoint, only if the score is above a certain threshold (e.g., confidence > 0.75). This will help you refine your strategy based on how narratives are shaped and their subsequent impact on sentiment.
Forming Gap Insights: Monitor forming gaps around commodities, Google, and oil, especially when mainstream narratives are leaning towards stability. If you detect a sentiment score that diverges significantly from these mainstream themes, it’s worth investigating further.
With these builds, you can ensure that your pipeline is not just reactive but anticipatory. Sentiment in commodities is a moving target, and being ahead of the curve requires agility in how we process and analyze this data.
Get started by checking our documentation at pulsebit.lojenterprise.com/docs. You can copy-paste these snippets and run them in under 10 minutes to catch those crucial insights before they slip away.


Top comments (0)