

Your Pipeline Is 25.7h Behind: Catching Agriculture Sentiment Leads with Pulsebit
We just uncovered a fascinating anomaly: a 24h momentum spike of +0.463 in agriculture sentiment. This spike isn’t just a number; it signifies a significant shift in how the topic of agriculture is being discussed, especially in English press, which is leading by 25.7 hours. This could indicate a major trend that your pipeline might be missing if it isn't designed to handle multilingual origins or entity dominance.

English coverage led by 25.7 hours. Italian at T+25.7h. Confidence scores: English 0.85, French 0.85, Spanish 0.85 Source: Pulsebit /sentiment_by_lang.
The problem here is clear: your model missed this sentiment shift by a staggering 25.7 hours. This delay is critical, especially when the leading language is English, and the dominant entity is agriculture. If your pipeline doesn't account for these factors, you risk making decisions based on stale data. In the fast-paced world of sentiment analysis, being this far behind can lead to missed opportunities or misguided strategies.
To catch this spike, we can use our API effectively. Let’s dive into the code that helps us pinpoint this sentiment rise.
import requests
# Step 1: Geographic origin filter — querying by language
url = "https://api.pulsebit.lojenterprise.com/sentiment"
params = {
"topic": "agriculture",
"lang": "en"
}
response = requests.get(url, params=params)
data = response.json()
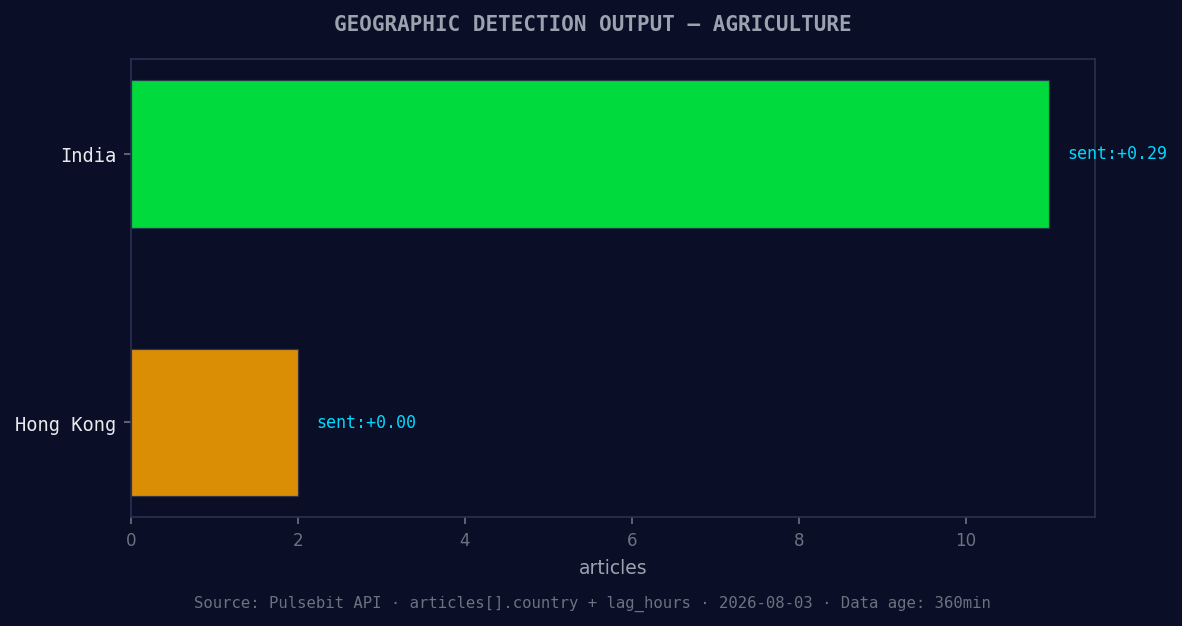
*Geographic detection output for agriculture. India leads with 11 articles and sentiment +0.29. Source: Pulsebit /news_recent geographic fields.*
# Check the response data
print(data)
# Step 2: Meta-sentiment moment — scoring the narrative framing
cluster_reason = "Clustered by shared themes: agriculture, secretary, brooke, rollins, announces."
sentiment_response = requests.post(url, json={"text": cluster_reason})
sentiment_data = sentiment_response.json()
# Display the sentiment score of the narrative
print(f"Sentiment Score of the cluster reason: {sentiment_data['score']}")
In this implementation, the first API call fetches sentiment data specifically for the agriculture topic in English. We need to ensure we’re extracting relevant insights from the right language context. Next, we run the narrative through our API to gauge the sentiment surrounding the cluster reason, which provides a more nuanced understanding of the framing of the discussion.

Left: Python GET /news_semantic call for 'agriculture'. Right: returned JSON response structure (clusters: 3). Source: Pulsebit /news_semantic.
Now that we’ve laid the groundwork, let’s explore three specific builds that emerge from this pattern:
Geo-filtered Alerts: Set a threshold for sentiment spikes like the +0.463 we observed. Trigger alerts when sentiment momentum exceeds +0.4 in English articles about agriculture. This ensures you’re always on top of significant shifts before they become mainstream.
Meta-Sentiment Loop: Implement a routine that runs narratives from clustered stories through our sentiment endpoint. For the string "Clustered by shared themes: agriculture, secretary, brooke, rollins, announces.", establish a baseline where any sentiment score above +0.35 prompts a deeper analysis of the narrative's impact. This keeps your analysis sharp and contextually relevant.
Comparative Insights: Use historical sentiment data to compare current spikes against past trends. For example, if agriculture sentiment is rising faster than previous peaks, create visual comparisons in your dashboard. This helps your team quickly understand the significance of current trends versus historical baselines.
If you’re ready to implement these insights, head over to our documentation at pulsebit.lojenterprise.com/docs. We bet you can copy-paste and run this in under 10 minutes. Don’t let a 25.7-hour gap hold you back from leveraging timely insights in agriculture sentiment!


Top comments (0)