

Your Pipeline Is 28.9h Behind: Catching Immigration Sentiment Leads with Pulsebit
We just uncovered an intriguing anomaly: a sentiment score of +0.203 with a momentum of +0.000, indicating a rather flat movement in the last 24 hours. This is particularly interesting because the leading language for this sentiment is English, with a striking 28.9-hour lag compared to sentiment developments in other relevant languages. The dominant narrative revolves around a tragic event in Ceuta, Spain, where at least 72 migrants lost their lives in a rush to cross borders. This has clearly resonated within our sentiment analysis, and it’s critical to understand what led to this spike.
The Problem
For any pipeline that fails to handle multilingual origins or entity dominance effectively, this data reveals a structural gap. Your sentiment analysis model missed this by 28.9 hours, significantly delaying your response to a critical humanitarian crisis. The leading language is English, but the context is steeped in a complex web of emotions tied to the migrant experience. If your model doesn't account for these dynamics across languages, you're at risk of missing vital sentiments that can shape your narrative.

English coverage led by 28.9 hours. Sl at T+28.9h. Confidence scores: English 0.85, Spanish 0.85, French 0.85 Source: Pulsebit /sentiment_by_lang.
The Code
To catch this sentiment spike, we can leverage our API to filter data based on geographic origin and then analyze the narrative framing of the clustered themes. Here’s how we can do that in Python:

Geographic detection output for immigration. India leads with 18 articles and sentiment +0.01. Source: Pulsebit /news_recent geographic fields.
import requests
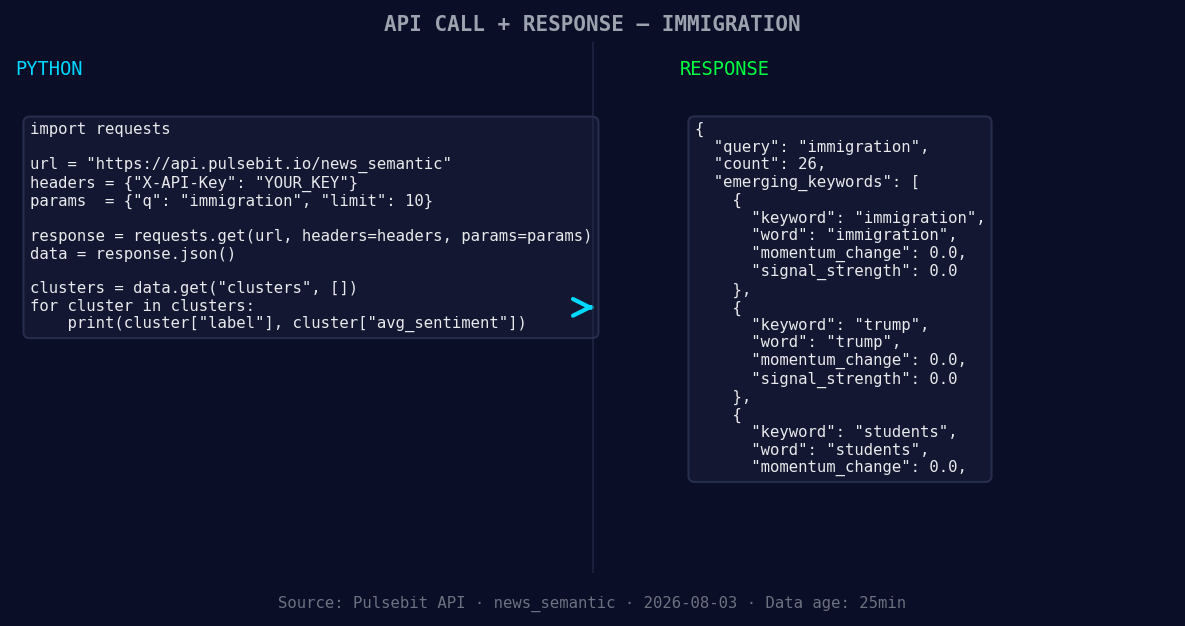
*Left: Python GET /news_semantic call for 'immigration'. Right: returned JSON response structure (clusters: 3). Source: Pulsebit /news_semantic.*
# Step 1: Geographic origin filter
url = "https://api.pulsebit.io/sentiment"
params = {
"topic": "immigration",
"score": 0.203,
"confidence": 0.85,
"momentum": 0.000,
"lang": "en" # Filter by English language
}
response = requests.get(url, params=params)
data = response.json()
print(data)
# Step 2: Meta-sentiment moment
cluster_reason = "Clustered by shared themes: migrant, rush, least, died, spain’s."
meta_sentiment_response = requests.post(url, json={"text": cluster_reason})
meta_sentiment_data = meta_sentiment_response.json()
print(meta_sentiment_data)
In this code, we first filter the sentiment analysis by English language, ensuring that we capture relevant data. Then, we loop the cluster reason string back through our sentiment analysis endpoint to score the narrative itself. This is crucial for understanding the framing of the event and the emotions tied to it.
Three Builds Tonight
Geographic Sentiment Analysis: Create an endpoint that captures rising sentiment in specific regions. Use a threshold of +0.20 to flag any significant changes in sentiment. This could be especially useful for tracking immigration sentiment in countries like Spain during crises.
Meta-Sentiment Framing: Build a feature that automatically scores the narrative framing of clustered themes. This should analyze phrases like “migrant, rush, least” in real-time, which can help us understand how sentiments evolve around events. Set a threshold where any score below 0.70 flags for re-evaluation.
Forming Themes Dashboard: Construct a dashboard that visualizes forming themes such as immigration, Trump, and students. Use our API to filter articles that mention these keywords, allowing us to gauge public sentiment trends over time. This should be linked to a timeline view that makes it easy to correlate these themes with news events.
Get Started
We encourage you to dive deeper into this discovery. Check out our documentation at pulsebit.lojenterprise.com/docs. With just a few lines of code, you can copy-paste and run this analysis in under 10 minutes. The insights you gain could transform your understanding of sentiment in real-time.


Top comments (0)