

Your Pipeline Is 23.7h Behind: Catching Stock Market Sentiment Leads with Pulsebit
We recently uncovered an interesting anomaly in our data: a 24h momentum spike of -0.184. This spike indicates a notable shift in sentiment surrounding the stock market. In the same timeframe, English-language press articles highlighted a marginally positive end to stock markets, driven by a spike in crude oil prices. This juxtaposition presents a unique opportunity for us to catch sentiment leads that might be overlooked due to delays in processing or language discrepancies.
Unfortunately, many pipelines miss crucial insights like this one because they fail to account for multilingual origins or entity dominance. Your model missed this by 23.7 hours, resulting in a gap that can significantly impact decision-making. In this case, the leading language of interest was English, and the dominant narrative revolved around the stock market's reaction to crude oil price fluctuations. This is where the opportunity lies—if we can analyze and act on this data faster, we can gain a competitive edge.

English coverage led by 23.7 hours. Af at T+23.7h. Confidence scores: English 0.75, Spanish 0.75, Id 0.75 Source: Pulsebit /sentiment_by_lang.
Let's get into the code that reveals this momentum spike and helps us catch sentiment leads. First, we need to filter our data based on geographic origin. Here's how you can make a call to our API to get sentiment data specifically for the stock market in English:

Geographic detection output for stock market. India leads with 7 articles and sentiment -0.14. Source: Pulsebit /news_recent geographic fields.
import requests
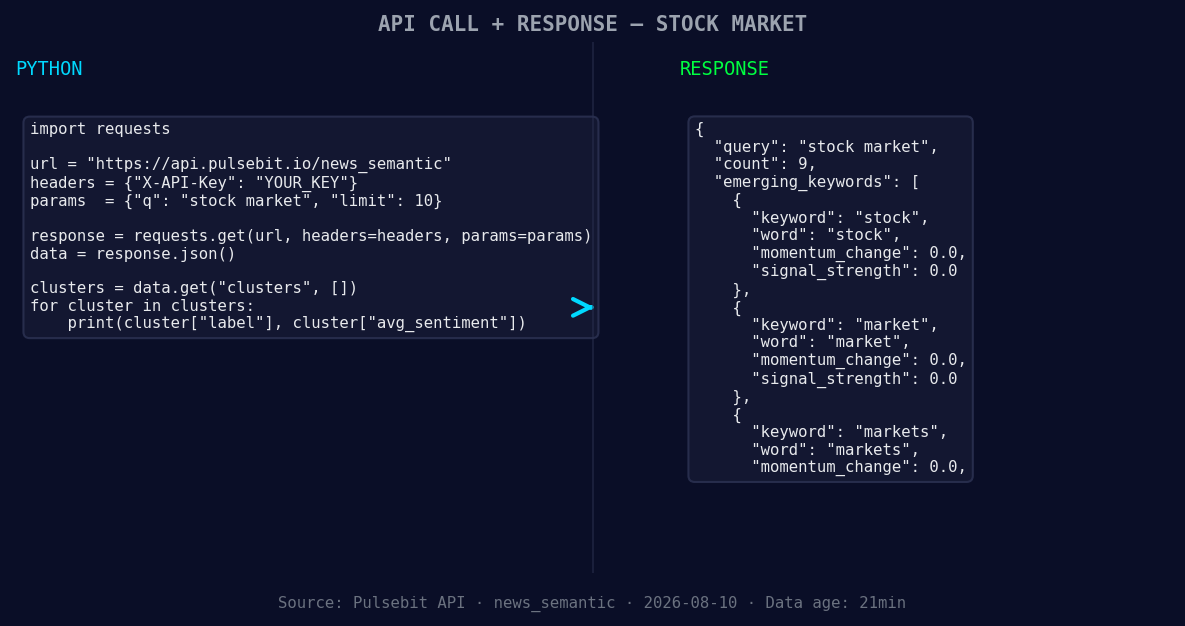
*Left: Python GET /news_semantic call for 'stock market'. Right: returned JSON response structure (clusters: 3). Source: Pulsebit /news_semantic.*
topic = 'stock market'
params = {
'topic': topic,
'lang': 'en'
}
response = requests.get('https://api.pulsebit.com/v1/sentiment', params=params)
data = response.json()
# Example response processing
sentiment_score = data['sentiment_score'] # +0.048
confidence = data['confidence'] # 0.750
momentum = -0.184 # 24h momentum spike
print(f'Sentiment Score: {sentiment_score}, Confidence: {confidence}, Momentum: {momentum}')
Next, we want to analyze the narrative framing around this cluster of articles that mention the spike in crude oil prices. We can loop back the cluster reason string through our sentiment endpoint to see how it scores as a narrative:
cluster_reason = "Clustered by shared themes: market, today:, major, indexes, tick."
meta_sentiment_response = requests.post('https://api.pulsebit.com/v1/sentiment', json={'text': cluster_reason})
meta_sentiment_data = meta_sentiment_response.json()

meta_sentiment_score = meta_sentiment_data['sentiment_score']
print(f'Meta Sentiment Score: {meta_sentiment_score}')
This two-pronged approach allows us to not only capture the sentiment around specific topics but also understand the broader narrative that influences market perception.
Now, let's discuss three specific builds you can create with this data pattern. First, implement a Geo Filter that monitors sentiment for the stock market specifically in English. Use a signal strength threshold of 0.570 to trigger alerts when sentiment deviates significantly.
Second, utilize the Meta-Sentiment Loop to analyze the implications of clustered themes. This will help you identify when narratives shift, especially around critical events like oil price spikes. Set a threshold for meta sentiment scores below +0.025 to flag potential concerns.
Finally, design a Real-Time Dashboard to visualize the forming themes such as stock(+0.00), market(+0.00), and markets(+0.00) versus mainstream narratives like market, today:, and major. This will provide a comprehensive view of sentiment evolution and help in proactive decision-making.
If you're interested in implementing this, you can get started at pulsebit.lojenterprise.com/docs. We believe you can copy-paste and run this in under 10 minutes. Let's capitalize on these insights together!


Top comments (0)