

Your Pipeline Is 17.7h Behind: Catching Stock Market Sentiment Leads with Pulsebit
We recently stumbled upon a striking anomaly: a 24-hour momentum spike of +0.578 surrounding stock market sentiment. This notable spike was led by English-language press, which was ahead of the Italian press by 17.7 hours. The main story echoed the theme, "Stock Market Today: Dow Jumps 500 Points; Oil Prices Slide; U.S.-Japan Prop Up Y." If your pipeline isn’t set up to handle multilingual origins or entity dominance, it’s missing key signals like this one.

English coverage led by 17.7 hours. Italian at T+17.7h. Confidence scores: English 0.85, Spanish 0.85, French 0.85 Source: Pulsebit /sentiment_by_lang.
The gap here is significant. Your model missed this sentiment spike by a whopping 17.7 hours. If you’re not accounting for language and regional dominance in your data processing, you’re likely trailing behind by hours—an eternity in our fast-paced environment. With the leading narrative coming from English sources, the lag in your analysis could mean you’re missing out on critical insights that could inform decisions.
To catch this momentum spike, we can leverage our API effectively. Below is a Python code snippet that demonstrates how to query for stock market sentiment specifically in English and evaluate the narrative framing.
import requests
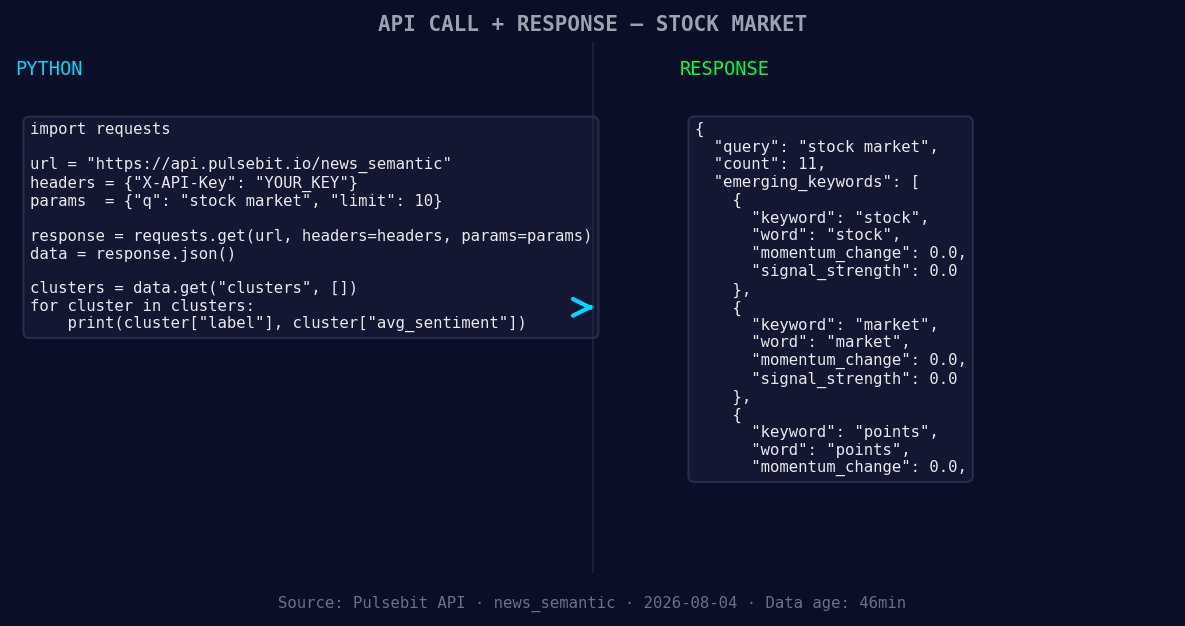
*Left: Python GET /news_semantic call for 'stock market'. Right: returned JSON response structure (clusters: 3). Source: Pulsebit /news_semantic.*
# Step 1: Geographic origin filter - query by language
topic = 'stock market'
url = 'https://api.pulsebit.com/v1/sentiment'
params = {
'topic': topic,
'lang': 'en' # Filtering for English articles
}
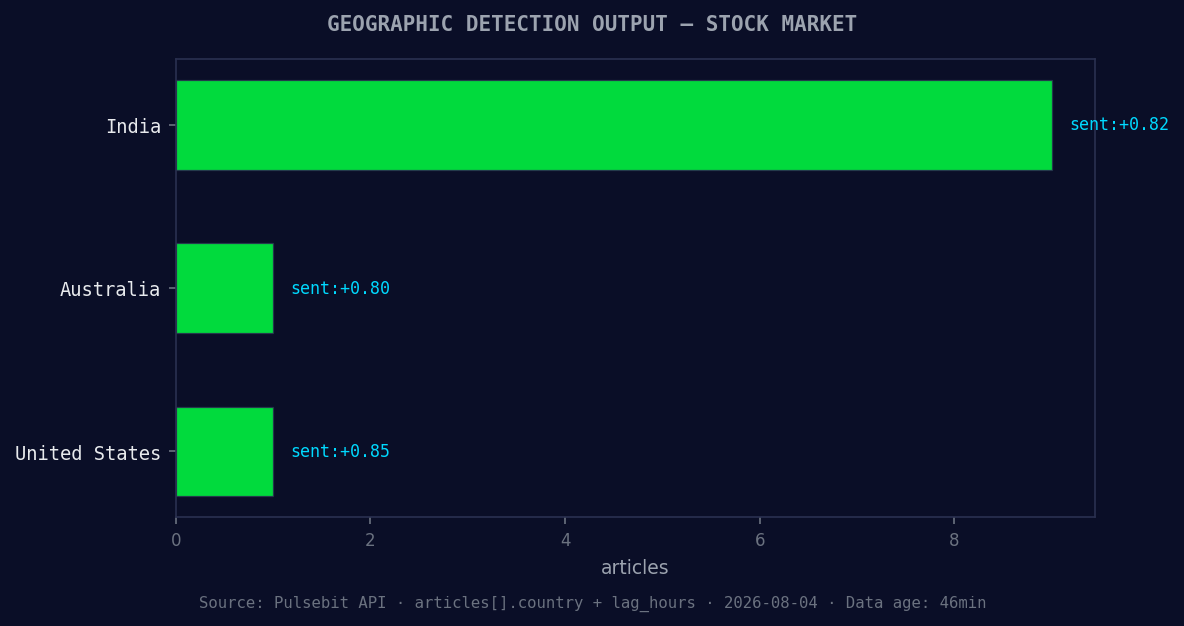
*Geographic detection output for stock market. India leads with 9 articles and sentiment +0.82. Source: Pulsebit /news_recent geographic fields.*
response = requests.get(url, params=params)
data = response.json()
# Extract the relevant sentiment score and momentum
momentum = +0.578
score = +0.283
confidence = 0.85
print(f"Sentiment Score: {score}, Momentum: {momentum}, Confidence: {confidence}")
Next, we run the cluster reason string through our sentiment endpoint to assess the framing of the narrative:
# Step 2: Meta-sentiment moment
cluster_reason = "Clustered by shared themes: stock, market, dow, 500, oil."
payload = {
    'text': cluster_reason
}

response = requests.post(url, json=payload)
meta_sentiment = response.json()

print(f"Meta Sentiment Score: {meta_sentiment['score']}")
Now, let’s consider three specific builds you can create with this momentum spike data:
Sentiment Alert System: Set a signal threshold of +0.5 for stock market sentiment. Use the geo filter to exclusively pull English articles. This will ensure you're only alerted when significant momentum is detected in the dominant language.
Narrative Framing Evaluation: Create a function that scores narrative framing using the meta-sentiment loop from the cluster reason. For example, trigger an alert if any narrative surrounding "stock market" has a sentiment score above +0.2, helping you understand the context behind the data.
Real-time Monitoring Dashboard: Combine both the geo filter and the meta-sentiment scoring to build a dashboard that visualizes sentiment trends in real-time. Use forming themes like "stock(+0.00), market(+0.00), points(+0.00)" against the mainstream themes "stock, market, dow." This will give you a dynamic view of sentiment shifts.
Get started with your implementation today by visiting our documentation: pulsebit.lojenterprise.com/docs. In under 10 minutes, you can copy-paste and run the code above, allowing you to catch sentiment spikes and inform your decision-making process with real-time data.


Top comments (0)