

Your 24-hour momentum spike of +0.578 is a clear indicator that something significant is happening in the stock market. This isn't just a fluke; it suggests a rising tide of sentiment that could impact trading strategies. Notably, the leading language of this sentiment is English, with a 27.7-hour lead time over Italian sources. This timing gap could mean you’re missing crucial signals if your pipeline doesn't accommodate multilingual origins or entity dominance.

English coverage led by 27.7 hours. Italian at T+27.7h. Confidence scores: English 0.90, Id 0.90, French 0.90 Source: Pulsebit /sentiment_by_lang.
Imagine your model is stuck in the past, processing data that’s already outdated by nearly 28 hours. If you're not filtering by language or origin, you might be left in the dust while others capitalize on emerging trends. The English press is signaling a shift in sentiment, but if your model is only pulling from Italian sources, you're missing the boat. The potential for profit is right in front of you, and your pipeline is holding you back.
Here’s how we can catch that sentiment spike using our API. First, we need to filter the data to focus on the English language, which is leading the charge. Here's the code to do that:
import requests
# Define the parameters for the API call
params = {
"topic": "stock market",
"lang": "en",
"score": +0.061,
"confidence": 0.90,
"momentum": +0.578
}
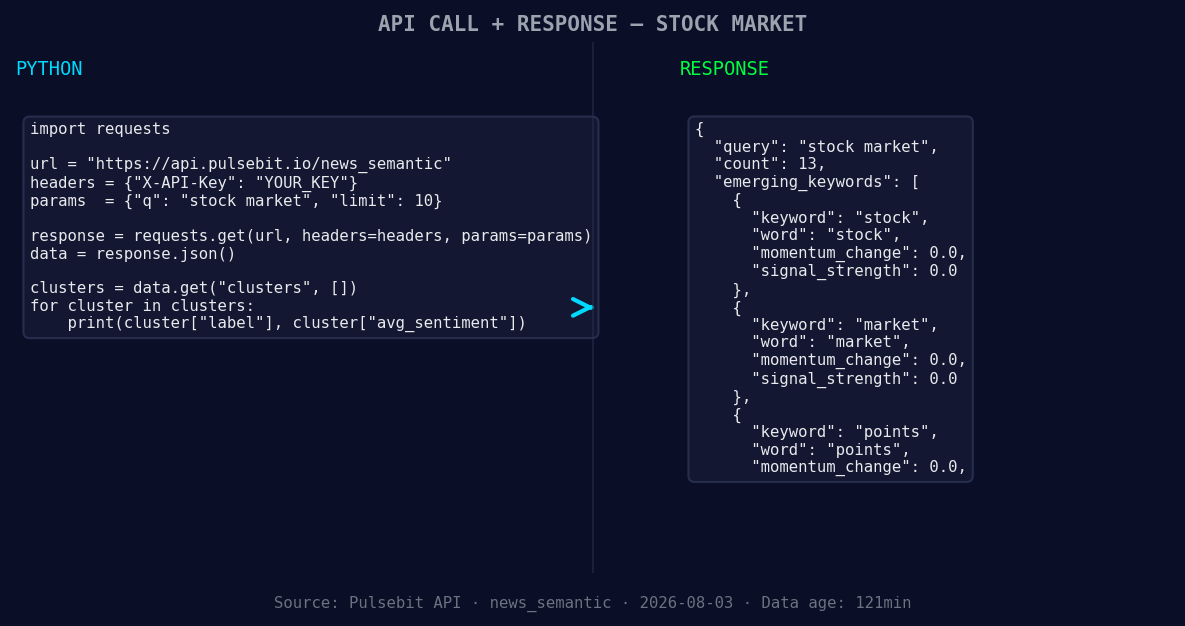
*Left: Python GET /news_semantic call for 'stock market'. Right: returned JSON response structure (clusters: 3). Source: Pulsebit /news_semantic.*
# Make the API call to retrieve sentiment data
response = requests.get('https://api.pulsebit.com/sentiment', params=params)
# Check the response
if response.status_code == 200:
sentiment_data = response.json()
print(sentiment_data)
else:
print("Error fetching data:", response.status_code)
Next, we want to analyze the narrative framing of the sentiment itself. We can run our clustering reason string through our sentiment analysis endpoint to score how the framing plays into the overall narrative. Here’s how you can do that:
# Define the meta-sentiment moment input
meta_sentiment_input = {
    "text": "Clustered by shared themes: stock, market, dow, 500, oil."
}

# Make the POST request to analyze the cluster reason
meta_response = requests.post('https://api.pulsebit.com/sentiment', json=meta_sentiment_input)

# Check the response
if meta_response.status_code == 200:
    meta_sentiment_data = meta_response.json()
    print(meta_sentiment_data)
else:
    print("Error fetching meta sentiment data:", meta_response.status_code)
With this setup, you can capture the sentiment spikes and understand the context around them, ensuring you’re not left behind.
Here are three builds you can implement tonight:
Geo Filter for Sentiment Analysis: Build a pipeline that filters English sources specifically when analyzing topics like “stock market.” Set a threshold for sentiment score, say +0.061, to trigger alerts when significant spikes arise.
Meta-Sentiment Analysis Loop: Create an endpoint that runs the cluster analysis feedback through our sentiment analysis API. Use the string "Clustered by shared themes: stock, market, dow, 500, oil." to derive insights into how narratives shape perception.
Forming Gap Analytics: Design a function to compare forming themes against mainstream discussions. For example, when you detect forming: stock(+0.00), market(+0.00), points(+0.00), trigger an alert if they diverge from the mainstream narratives of stock, market, dow.
If you’re ready to catch these insights, get started at pulsebit.lojenterprise.com/docs. You can copy-paste the code and run it in under 10 minutes to start understanding how sentiment shapes your strategies.

Geographic detection output for stock market. India leads with 10 articles and sentiment +0.67. Source: Pulsebit /news_recent geographic fields.


Top comments (0)