

Your Pipeline Is 25.0h Behind: Catching Data Science Sentiment Leads with Pulsebit
We just encountered a compelling anomaly in our sentiment analysis: a 24h momentum spike of -0.179. This isn't just a random fluctuation; it signals a significant shift in the conversation around data science. The leading language for the press surrounding this topic is English, with a notable 25-hour lag. If you’re not accounting for language and entity dominance in your pipeline, you might have missed this vital signal by a whole day.
When your model isn't handling multilingual origin or entity dominance, it creates structural gaps in your analysis. In this instance, the dominant conversation is being driven by English-language content, and if your pipeline isn’t equipped to catch this, you’re effectively sitting on the sidelines. Your model missed this by 25 hours, leaving you behind in leveraging critical sentiment shifts that can inform your data strategies.

English coverage led by 25.0 hours. Et at T+25.0h. Confidence scores: English 0.85, Spanish 0.85, Nl 0.85 Source: Pulsebit /sentiment_by_lang.
Here’s how to catch that momentum spike in your pipeline using our API effectively.
import requests
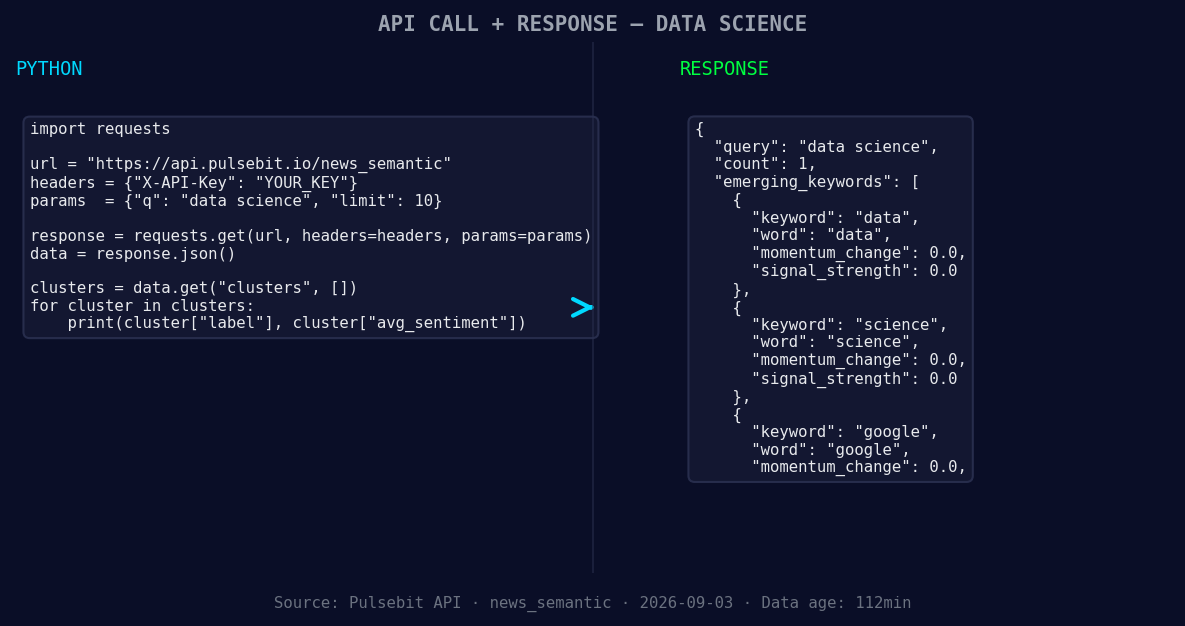
*Left: Python GET /news_semantic call for 'data science'. Right: returned JSON response structure (clusters: 3). Source: Pulsebit /news_semantic.*
# Geographic origin filter
url = "https://api.pulsebit.com/v1/articles"
params = {
"topic": "data science",
"lang": "en",
"score": +0.604,
"confidence": 0.85,
"momentum": -0.179
}
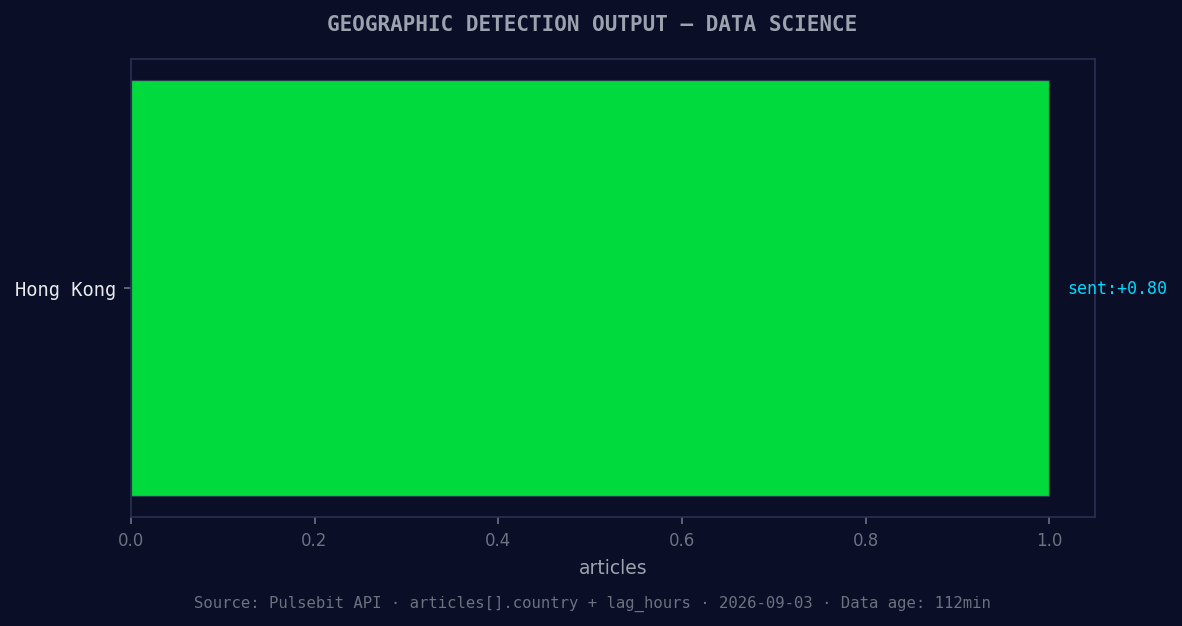
*Geographic detection output for data science. Hong Kong leads with 1 articles and sentiment +0.80. Source: Pulsebit /news_recent geographic fields.*
response = requests.get(url, params=params)
articles = response.json()
print(articles)
Now, let’s take the cluster reason string and score its narrative framing. This adds a layer of depth to your analysis by examining how the themes connect within the narrative.
# Meta-sentiment moment
url = "https://api.pulsebit.com/v1/sentiment"
data = {
    "text": "Clustered by shared themes: data, skills, will, keep, scientists."
}

response = requests.post(url, json=data)
sentiment_analysis = response.json()
print(sentiment_analysis)
This two-step approach allows us to filter relevant English articles while also understanding how the narrative itself is positioned around crucial themes of data and skills, which are forming a gap versus the mainstream conversation.
Three Builds Tonight
Geo-filtered Signal: Create a signal that alerts you whenever there's a sentiment shift in English articles about data science that falls below a threshold of -0.1. Set up a webhook that triggers when this happens.
Meta-Sentiment Loop: Build a dashboard using the meta-sentiment loop to visualize how the narrative is evolving around the themes of data, science, and Google. Use the sentiment scores from the API to plot trends over time.
Cluster Analysis: Set up a cluster analysis that tracks articles related to data and science, then correlate these with sentiment scores to identify leading indicators of market shifts. Focus on the forming themes of data and science, which currently show a stable sentiment at +0.00, as compared to mainstream themes.
Getting started is straightforward. Our documentation provides all the details you need to run these analyses. Head over to pulsebit.lojenterprise.com/docs and start implementing these insights. You can copy-paste and run this in under 10 minutes.


Top comments (0)