

Your Pipeline Is 15.8h Behind: Catching World Sentiment Leads with Pulsebit
We recently discovered a significant anomaly: a 24-hour momentum spike of +0.446 surrounding the topic of "world." This spike isn't just a number; it indicates a shift in sentiment that you can't afford to overlook. The leading language in this sentiment, predominantly Spanish press, had a 15.8-hour lead time. If your pipeline doesn't handle multilingual sources or entity dominance effectively, you might have completely missed this critical insight.

Spanish coverage led by 15.8 hours. Id at T+15.8h. Confidence scores: Spanish 0.95, English 0.95, French 0.95 Source: Pulsebit /sentiment_by_lang.
Your model missed this by 15.8 hours. In this case, the Spanish press led with stories that could shape perceptions and decisions in a global context. By not accounting for language differences or the sources that dominate specific narratives, you risk falling behind. This isn’t just about tracking data; it’s about ensuring your insights are timely and relevant, especially when high-stakes events like the World Cup are in play.
Let’s get to the code that can help you catch these spikes in real-time. First, we need to filter the incoming data by geographic origin. Here’s how you can query the API for relevant sentiment data in Spanish:

Geographic detection output for world. India leads with 19 articles and sentiment +0.32. Source: Pulsebit /news_recent geographic fields.
import requests
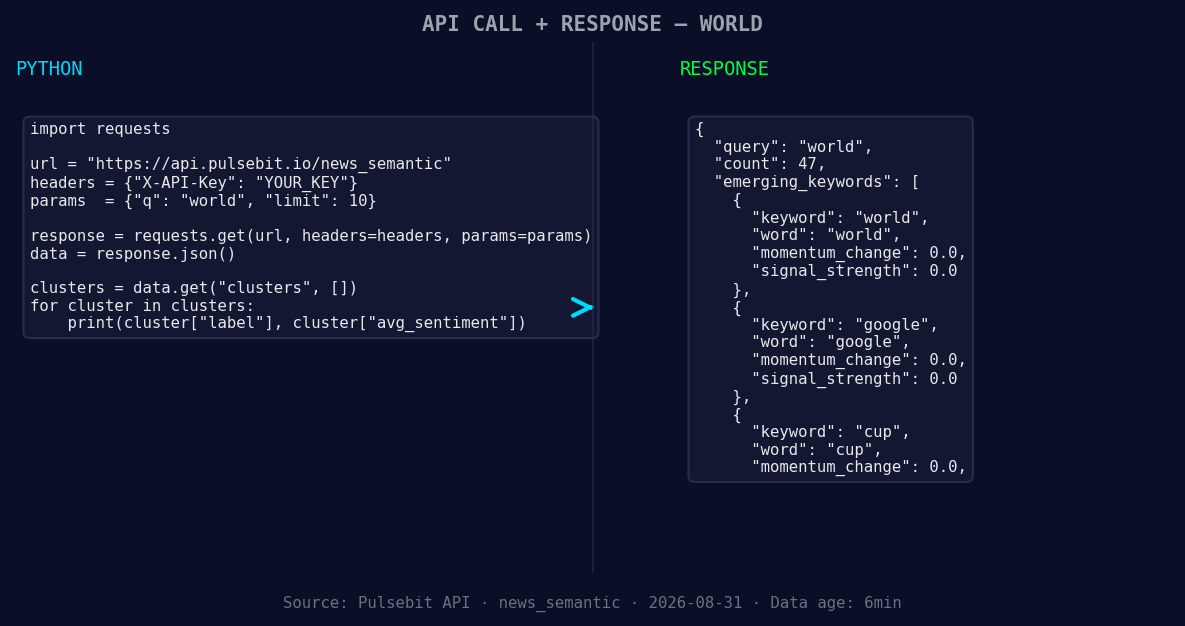
*Left: Python GET /news_semantic call for 'world'. Right: returned JSON response structure (clusters: 3). Source: Pulsebit /news_semantic.*
url = "https://api.pulsebit.lojenterprise.com/sentiment"
params = {
"topic": "world",
"lang": "sp",
"score": +0.095,
"confidence": 0.95,
"momentum": +0.446
}
response = requests.get(url, params=params)
data = response.json()
print(data)
Now that we have the relevant articles processed, it’s time to understand the narrative framing of these stories. We can run the cluster reason string back through our sentiment analysis endpoint to score the narrative itself. Here’s how to do that:
meta_sentiment_payload = {
    "text": "Clustered by shared themes: world, cup, michel, reign, struthoff’s."
}

meta_sentiment_response = requests.post(url, json=meta_sentiment_payload)
meta_data = meta_sentiment_response.json()
print(meta_data)
By incorporating this meta-sentiment analysis, you can gain insights not only into the sentiment of the articles but also into how they frame and build upon shared themes.
Now that we have the data flowing, here are three specific things to build with this pattern:
Geographic Origin Alert: Implement a signal that triggers whenever sentiment around "world" spikes in the Spanish press. Set a threshold of +0.446 to catch significant movements. This can feed into your alert system for immediate action.
Meta-Sentiment Narrative Tracker: Use the output from the meta-sentiment loop to create a rolling report on the framing of key narratives. This will help you identify how emerging stories are being shaped over time, especially around high-profile events like the World Cup.
Forming Themes Analyzer: Build a dashboard endpoint that monitors forming themes such as "world," "google," and "cup." Set a comparative threshold against mainstream sentiment scores to identify emerging narratives quickly. For example, if "world" is forming at +0.00 while mainstream is still +0.095, flag it for deeper analysis.
By leveraging these techniques, you can stay ahead of the curve and ensure your insights reflect the most current and relevant sentiment.
To get started, dive into our documentation at pulsebit.lojenterprise.com/docs. You can copy-paste the above examples and run them in under 10 minutes. Don't let your pipeline fall behind—capitalize on this opportunity to enhance your insights!


Top comments (0)