

Your Pipeline Is 22.1h Behind: Catching Music Sentiment Leads with Pulsebit
We recently found a striking anomaly: a 24-hour momentum spike of +0.447 in music sentiment. This data point isn’t just a number—it's the tip of an iceberg revealing a significant shift in public sentiment. Articles related to Dolly Parton accepting a posthumous music lifetime achievement award are driving this spike, but what if your pipeline missed this critical moment because it wasn't equipped to handle multilingual origins or dominant entities?

English coverage led by 22.1 hours. Da at T+22.1h. Confidence scores: English 0.90, French 0.90, Spanish 0.90 Source: Pulsebit /sentiment_by_lang.
Your model missed this by 22.1 hours, while the leading English-language press was buzzing about it. With 12% share of voice and a positive sentiment score of +0.793, the conversation is clearly vibrant. But without the right tools to capture and interpret these spikes, you risk falling behind.
To catch these critical moments, we can leverage our API effectively. Here’s how you can do it in Python:
import requests
# Define the parameters for our API call
topic = 'music'
score = +0.468
confidence = 0.90
momentum = +0.447
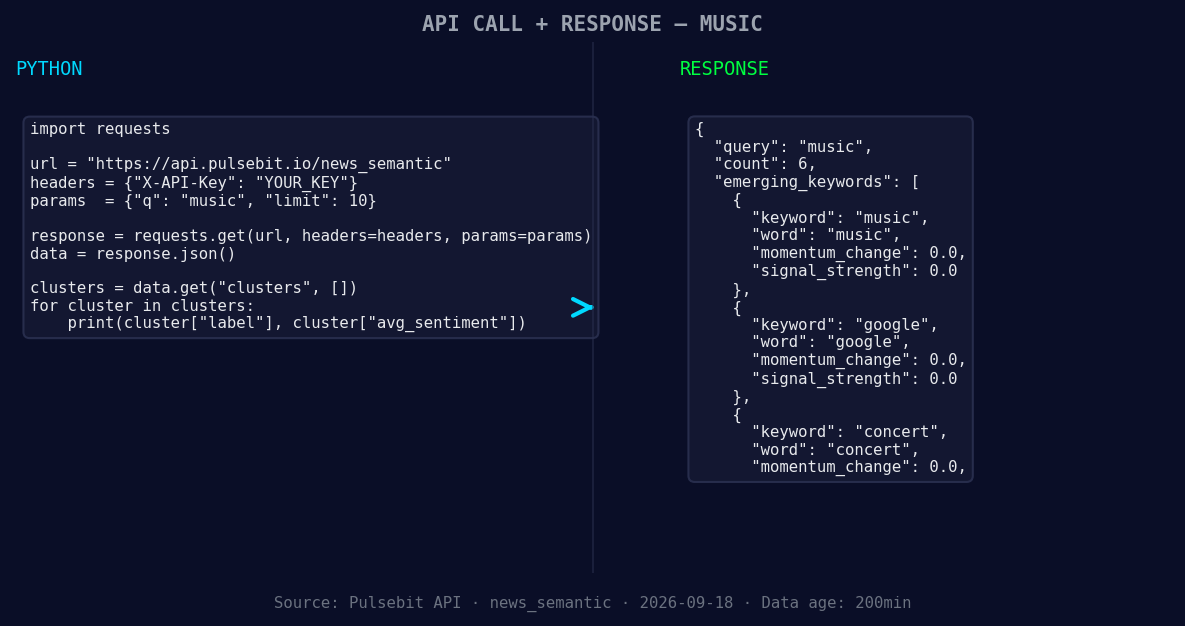
*Left: Python GET /news_semantic call for 'music'. Right: returned JSON response structure (clusters: 3). Source: Pulsebit /news_semantic.*
# Geographic origin filter: query by language
response = requests.get('https://api.pulsebit.com/sentiment', params={
'topic': topic,
'score': score,
'confidence': confidence,
'momentum': momentum,
'lang': 'en'
})
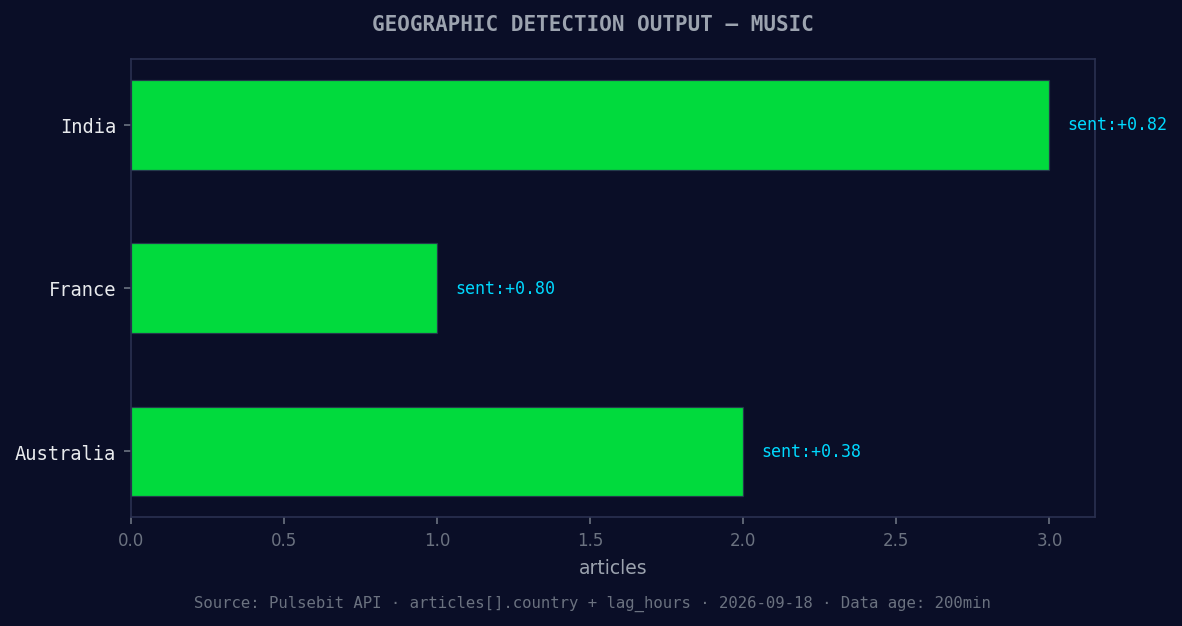
*Geographic detection output for music. India leads with 3 articles and sentiment +0.82. Source: Pulsebit /news_recent geographic fields.*
# Check if the response was successful
if response.status_code == 200:
data = response.json()
print(data)
else:
print(f"Error: {response.status_code}")
Next, we need to assess the narrative framing itself. We'll run our cluster reason string back through our sentiment endpoint to score it. For our example:
# Meta-sentiment moment
cluster_reason = "Clustered by shared themes: yuvan, shankar, raja, his, first."
meta_sentiment_response = requests.post('https://api.pulsebit.com/sentiment', json={
    'text': cluster_reason
})

# Check the response for meta-sentiment
if meta_sentiment_response.status_code == 200:
    meta_data = meta_sentiment_response.json()
    print(meta_data)
else:
    print(f"Error: {meta_sentiment_response.status_code}")
Now that we've established the mechanics, let’s delve into specific builds based on this pattern. Here are three actionable ideas:
Geo-Sentiment Dashboard: Set up a real-time dashboard that captures sentiment spikes in the music category, filtered by English-language articles. Use the API call outlined above to visualize changes and alert your team when momentum exceeds a threshold of +0.4.
Meta-Sentiment Narratives: Enhance your reporting by incorporating meta-sentiment insights. Utilize the loop we created to score narrative frames around dominant entities like "yuvan" and "shankar". Define a threshold where any score above +0.5 indicates significant narrative framing.
Forming Themes Tracker: Build a tracking system that captures forming themes in real-time. Specifically monitor the keywords "music", "google", and "concert" to see how they trend against mainstream entities like "yuvan" and "shankar". Trigger alerts when sentiment scores deviate significantly from baseline expectations.
These builds not only enhance your pipeline but also ensure you remain ahead in recognizing shifts in sentiment. With the right infrastructure in place, you can proactively respond to trends rather than play catch-up.
To dive deeper, visit our documentation at pulsebit.lojenterprise.com/docs and get started. You can copy and paste the code above and run it in under 10 minutes, putting you on the cutting edge of sentiment analysis in the music domain.


Top comments (0)