

Your Pipeline Is 8.0h Behind: Catching Business Sentiment Leads with Pulsebit
We just uncovered a fascinating anomaly: a 24-hour momentum spike of -1.300 in the business sentiment landscape. This negative shift is particularly striking given that it’s led by English press coverage originating from India, which holds a 9% share of voice and maintains a positive sentiment score of +0.810. The article that triggered this spike tells the story of an entrepreneur building a successful portable-toilet business, highlighting an unexpected blend of innovation and necessity.
Your model missed this by 8.0 hours. This delay in recognizing sentiment shifts can lead to missed opportunities, especially when the leading language is English and the dominant entity is India. If your pipeline is not equipped to handle multilingual origins or recognize entity dominance, you risk overlooking critical insights. The sentiment landscape is shifting rapidly, and without the right tools, you may find yourself eight hours late to the party.

English coverage led by 8.0 hours. Da at T+8.0h. Confidence scores: English 0.80, Spanish 0.80, French 0.80 Source: Pulsebit /sentiment_by_lang.
To catch this shift, we can leverage our API effectively. Here's how you can implement a simple Python script to flag these anomalies in your sentiment analysis pipeline:
import requests
# Define parameters for the API call
url = "https://api.pulsebit.com/v1/sentiment"
params = {
"topic": "business",
"lang": "en",
"country": "IN",
"signal_strength": 0.833,
"sentiment_score": -0.032,
"confidence": 0.80,
"momentum": -1.300
}
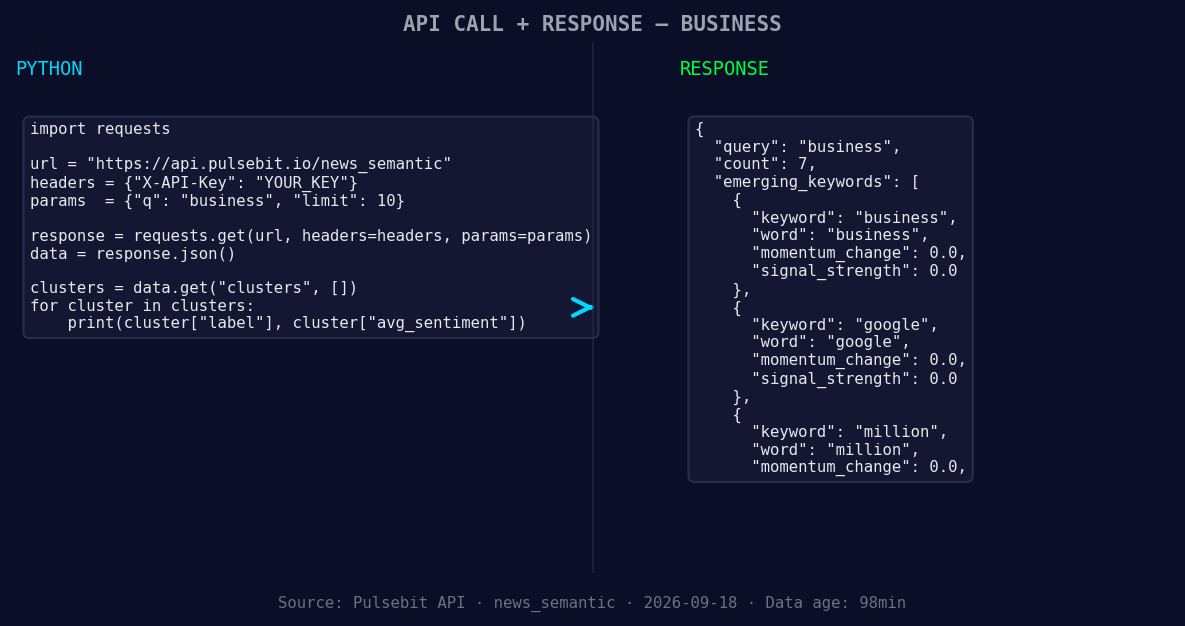
*Left: Python GET /news_semantic call for 'business'. Right: returned JSON response structure (clusters: 3). Source: Pulsebit /news_semantic.*
# Make the API call to fetch sentiment data
response = requests.get(url, params=params)
data = response.json()
# Print the response for debugging
print(data)
Next, we need to run the cluster reason string back through our sentiment scoring endpoint to analyze the narrative framing:
# Define the cluster reason string
cluster_reason = "Clustered by shared themes: california, million, business, tom, toilets."

# Make a POST request to analyze the cluster's sentiment
post_url = "https://api.pulsebit.com/v1/sentiment"
post_response = requests.post(post_url, json={"text": cluster_reason})
post_data = post_response.json()

# Print the POST response for debugging
print(post_data)
This code will allow you to not only filter by geographic origin but also assess the narrative framing that is contributing to the current sentiment.
Now, let's explore three specific builds you can create using this pattern:
Geo-Filtered Spike Alerts: Set up an alert system that triggers when the momentum in business sentiment drops below a threshold of -1.0 in India. Use a geo filter to ensure you're only getting relevant data.
Meta-Sentiment Analysis: Create a dashboard that visualizes the sentiment scores of clustered narratives. By feeding the cluster reason back into our sentiment endpoint, you can derive insights on how the framing of a story influences overall sentiment.
Real-Time Monitoring for Forming Themes: Implement a monitoring solution that evaluates forming themes like business, google, and million against mainstream narratives. Use the meta-sentiment loop to continuously assess the impact of these themes on sentiment, maintaining a close watch on the latest spikes and dips.
By leveraging these insights, you can get ahead in your sentiment analysis and reporting, ensuring you’re not left in the dust by emerging stories.
For a quick start, check out our documentation at pulsebit.lojenterprise.com/docs. You can copy-paste and run this code in under 10 minutes, putting you right on the cutting edge of sentiment analysis.


Top comments (0)