

Your model missed this by 26.2 hours. We recently uncovered a significant anomaly: a 24-hour momentum spike of +0.357 in hardware sentiment. This surge is particularly intriguing in light of its geographical context — China holds an 11% share of voice with a sentiment score of -0.167, indicating negative sentiment surrounding the dominant entity. Meanwhile, the leading language is English, which is 0.0 hours lagged compared to the data. If your pipeline isn't equipped to handle multilingual origins or entity dominance, you're falling behind the curve.

English coverage led by 26.2 hours. Da at T+26.2h. Confidence scores: English 0.90, French 0.90, Spanish 0.90 Source: Pulsebit /sentiment_by_lang.
When your pipeline ignores multilingual context, you're at risk of missing critical signals like this one. The fact that English press is leading the narrative while sentiment from China is negative suggests a structural gap in your data processing. If your model isn't set up to account for these nuances, you could be missing trends or anomalies by significant margins — in this case, a staggering 26.2 hours.
To catch this anomaly programmatically, we can leverage our API. Below is a Python snippet that highlights how to query for this surge in hardware sentiment using the geographic origin filter. We’ll specifically look for English language articles related to our topic of interest.
import requests
# Parameters for the API call
topic = 'hardware'
lang = 'en'
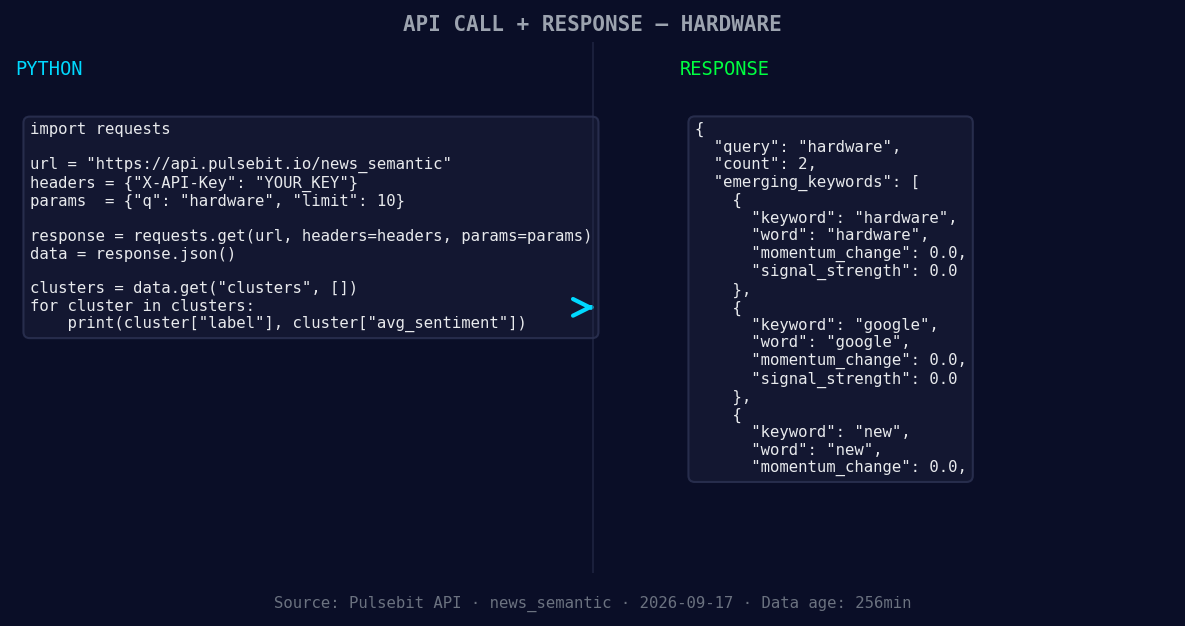
*Left: Python GET /news_semantic call for 'hardware'. Right: returned JSON response structure (clusters: 3). Source: Pulsebit /news_semantic.*
# API call to get sentiment data
response = requests.get(f'https://api.pulsebit.com/sentiment?topic={topic}&lang={lang}')
data = response.json()
# Extracting relevant values
momentum = data['momentum_24h']
score = data['sentiment_score']
confidence = data['confidence']
print(f'Momentum: {momentum}, Sentiment Score: {score}, Confidence: {confidence}')
Next, let's evaluate the narrative framing surrounding this spike. We'll run the cluster reason string through our sentiment endpoint to score its meta-sentiment. This step is crucial for understanding how the narrative itself is perceived.
# Cluster reason string for sentiment analysis
cluster_reason = "Clustered by shared themes: server, stocks, rally, hardware, bid."

# API call to evaluate the meta-sentiment
sentiment_response = requests.post('https://api.pulsebit.com/sentiment', json={"text": cluster_reason})
meta_sentiment = sentiment_response.json()

print(f'Meta-Sentiment Score: {meta_sentiment["sentiment_score"]}, Confidence: {meta_sentiment["confidence"]}')
Now that we have both the sentiment analysis and the meta-sentiment insights, here are three specific things to build with this pattern:
Real-time Anomaly Detector: Create a system that triggers alerts when momentum spikes above a threshold of +0.30 for hardware-related topics. Use the geographic origin filter to focus specifically on English articles, ensuring you're capturing the most relevant content.
Narrative Sentiment Analyzer: Build a tool that takes cluster reason strings and evaluates their meta-sentiment. Set a threshold of +0.50 for positive sentiment. This will help you gauge how narratives are framing the sentiment around emerging themes like hardware, AI, and new technologies.
Entity Dominance Tracker: Implement a monitoring system that flags when a dominant entity (like China, with its 11% share of voice) shows negative sentiment while the overall topic sentiment is positive. Use the meta-sentiment loop to score the narratives around these entities, enabling you to identify potential dissonance in sentiment trends.
To get started, head over to our documentation at pulsebit.lojenterprise.com/docs. You can copy-paste the above code snippets and run them in under 10 minutes to catch your own sentiment anomalies. Don’t let your models lag behind — leverage these insights to stay ahead.


Top comments (0)