

Your Pipeline Is 7.8h Behind: Catching Crypto Sentiment Leads with Pulsebit
We recently discovered a striking anomaly: a 24-hour momentum spike of -0.299 in the sentiment around crypto. This negative momentum, coupled with a dominant entity—Senate, which holds a 27% share of voice—suggests that the discourse is increasingly negative, particularly in light of the recent news story titled "Trump’s $1.4 Billion Haul Comes Back to Haunt Crypto Industry." This finding could have significant implications for how we react to market dynamics.
What does this mean for your current pipeline? If your model isn’t designed to handle multilingual origins or account for entity dominance, you may have missed this crucial development by a staggering 7.8 hours. With English press leading the conversation, your model's inability to assess the sentiment promptly could lead to missed trading opportunities or poor decision-making. In our experience, this is exactly the kind of gap that can catch developers off guard.

English coverage led by 7.8 hours. Da at T+7.8h. Confidence scores: English 0.80, Spanish 0.80, French 0.80 Source: Pulsebit /sentiment_by_lang.
Here’s how to catch this anomaly programmatically. First, let’s query our API to filter by language and extract the sentiment data around crypto:
import requests
# Define parameters for the API call
params = {
"topic": "crypto",
"lang": "en",
"score": -0.111,
"confidence": 0.80,
"momentum": -0.299
}
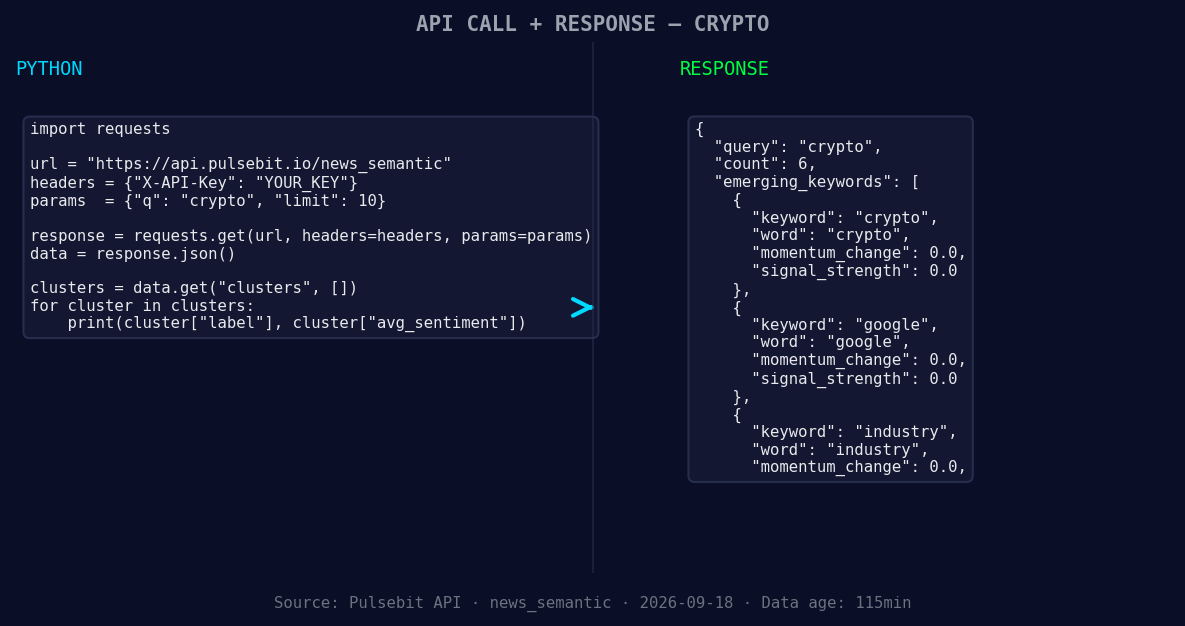
*Left: Python GET /news_semantic call for 'crypto'. Right: returned JSON response structure (clusters: 3). Source: Pulsebit /news_semantic.*
# Make the API call to get sentiment data
response = requests.get("https://api.pulsebit.com/sentiment", params=params)
data = response.json()
print(data)
Next, we’ll take a deeper look at the narrative framing. We can run the cluster reason string through our sentiment endpoint to better understand the implications of the news:
# Define the meta-sentiment input
meta_sentiment_input = "Clustered by shared themes: crypto, billion, industry, trump’s, haul."

# Call the sentiment endpoint with the narrative framing
meta_sentiment_response = requests.post("https://api.pulsebit.com/sentiment", json={"text": meta_sentiment_input})
meta_sentiment_data = meta_sentiment_response.json()
print(meta_sentiment_data)
With these two API calls, we can not only filter the sentiment data but also analyze the narrative that’s shaping the discourse. This is how we can make our models smarter and more responsive.
Now, let’s explore three specific builds you could implement using this pattern:
Geo-Filtered Sentiment Dashboard: Create a dashboard that visualizes sentiment trends by region. Use a geolocation filter to focus on areas with a high concentration of English articles. Trigger alerts when sentiment thresholds, such as momentum below -0.2, are crossed.
Meta-Sentiment Analyzer: Build a service that continuously analyzes the sentiment of clustered narratives. For example, if you see a negative score from the meta-sentiment analysis, alert your team to potential market impacts. Set a threshold of -0.2 for immediate action.
Forming Theme Tracker: Develop an endpoint that monitors forming themes like "crypto(+0.00), google(+0.00), industry(+0.00)" versus mainstream narratives. This could help in identifying emerging trends before they become widely recognized, especially when you notice significant deviations from the average sentiment score.
To get started, you can visit our documentation at pulsebit.lojenterprise.com/docs. With just a few lines of code, you can set up an alerting system that tracks sentiment shifts and ensures you never miss critical market signals again. You can copy-paste and run the examples we’ve shared in under 10 minutes.

Geographic detection output for crypto. United States leads with 6 articles and sentiment -0.67. Source: Pulsebit /news_recent geographic fields.


Top comments (0)