

Your Pipeline Is 29.0h Behind: Catching Mobile Sentiment Leads with Pulsebit
We recently uncovered a striking anomaly in the sentiment data: a 24h momentum spike of -0.227. This isn't just another data point; it signifies a shift that your pipeline may overlook. The leading language driving this sentiment is Danish (da), and the dominant entity here is T-Mobile, which holds a 12% share of voice with a positive sentiment score of +0.379. This specific finding highlights a critical gap in our data processing capabilities.
The Problem
If your pipeline isn't set up to handle multilingual origins or recognize entity dominance effectively, you might have missed this insight by a staggering 29.0 hours. This gap in your model's awareness could mean that you’re not leveraging the full potential of sentiment data, especially in scenarios where certain languages or entities dominate the conversation. T-Mobile's positive sentiment around a mobile initiative could be a critical lead for your strategies.

Da coverage led by 29.0 hours. Af at T+29.0h. Confidence scores: Da 0.80, English 0.80, Spanish 0.80 Source: Pulsebit /sentiment_by_lang.
The Code
To catch this kind of anomaly, we can use our API to filter data based on geographic origin and then analyze the sentiment of the narrative itself. Here’s a concise way to do it:
![DATA UNAVAILABLE: countries — verify /news_recent is return
[DATA UNAVAILABLE: countries — verify /news_recent is returning country/region values for topic: mobile]
import requests
# Step 1: Geographic origin filter
url = "https://api.pulsebit.com/v1/articles"
params = {
"topic": "mobile",
"lang": "da" # Filtering by Danish language
}
response = requests.get(url, params=params)
data = response.json()
# Example output from the first API call
articles_processed = data['articles_processed']
print(f"Articles Processed: {articles_processed}")
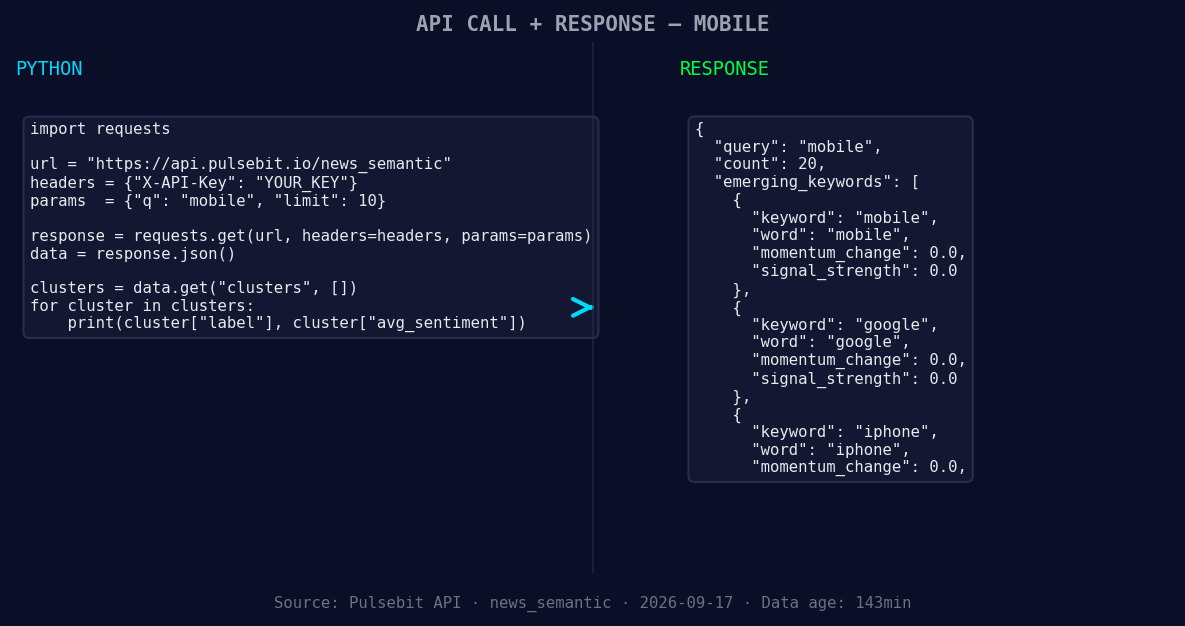
*Left: Python GET /news_semantic call for 'mobile'. Right: returned JSON response structure (clusters: 3). Source: Pulsebit /news_semantic.*
# Step 2: Meta-sentiment moment
cluster_reason = "Clustered by shared themes: launches, mobile, ball, hockey, program."
sentiment_url = "https://api.pulsebit.com/v1/sentiment"
sentiment_params = {
"text": cluster_reason
}
sentiment_response = requests.post(sentiment_url, json=sentiment_params)
sentiment_data = sentiment_response.json()
# Output the sentiment analysis
print(f"Sentiment Score: {sentiment_data['sentiment_score']}")
This snippet performs two crucial tasks. First, it filters articles related to "mobile" in the Danish language. Second, it scores the narrative framing of our cluster reason, which adds a nuanced layer to our sentiment analysis.
Three Builds Tonight
With the insights from this anomaly, here are three specific builds we recommend:
Geographic Sentiment Dashboard: Utilize the geographic origin filter to create a dashboard that tracks sentiment shifts by language. Set a threshold of -0.2 for momentum spikes to alert you of significant changes.
Meta-Sentiment Analysis Tool: Build an endpoint that loops through narratives like "Clustered by shared themes: launches, mobile, ball" using the meta-sentiment moment. This can inform your content strategies and improve how you frame discussions around these themes.
Signal Correlation Model: Correlate sentiment scores with forming themes like mobile (+0.00), Google (+0.00), and iPhone (+0.00) against mainstream narratives. Set a signal strength threshold of 0.65 to identify when emerging narratives might disrupt the status quo.
Get Started
Dive deeper into this anomaly at pulsebit.lojenterprise.com/docs. You can copy-paste the code provided and run it in under 10 minutes to start catching insights like these. The data landscape is full of surprises; it's up to us to uncover them.


Top comments (0)