

Your Pipeline Is 24.1h Behind: Catching Stock Market Sentiment Leads with Pulsebit
We recently spotted a fascinating anomaly: a 24h momentum spike of +0.206 in stock market sentiment. This spike caught our attention not just for its numerical value but for the implications it has on our understanding of sentiment trends. It reflects a notable shift in how sentiment is evolving around stock market narratives, particularly with mainstream coverage reporting a positive uplift due to easing oil prices. This is a clear signal that there’s something significant happening, and being able to detect it in real-time can give us a competitive edge.
However, if your existing pipeline isn’t designed to handle multilingual origins or dominant entities, you may have missed this momentum spike by 24.1 hours. This is particularly evident when we look at how the leading language in coverage is English, with a 0.0h lag compared to Italian coverage. If your model only picks up on one language, you could be left in the dust, capturing sentiment trends late and potentially missing out on actionable insights.

English coverage led by 24.1 hours. Italian at T+24.1h. Confidence scores: English 0.90, French 0.90, Spanish 0.90 Source: Pulsebit /sentiment_by_lang.
To ensure our models catch these critical shifts, here's the Python code we used to identify this momentum spike. We can filter our data by geographic origin and language using our API.
import requests
# Define parameters
topic = 'stock market'
lang = 'en'
score = +0.375
confidence = 0.90
momentum = +0.206
# Geographic origin filter: query by language/country
response = requests.get(
'https://api.pulsebit.com/news',
params={
'topic': topic,
'lang': lang,
'momentum': momentum,
'score': score,
'confidence': confidence
}
)
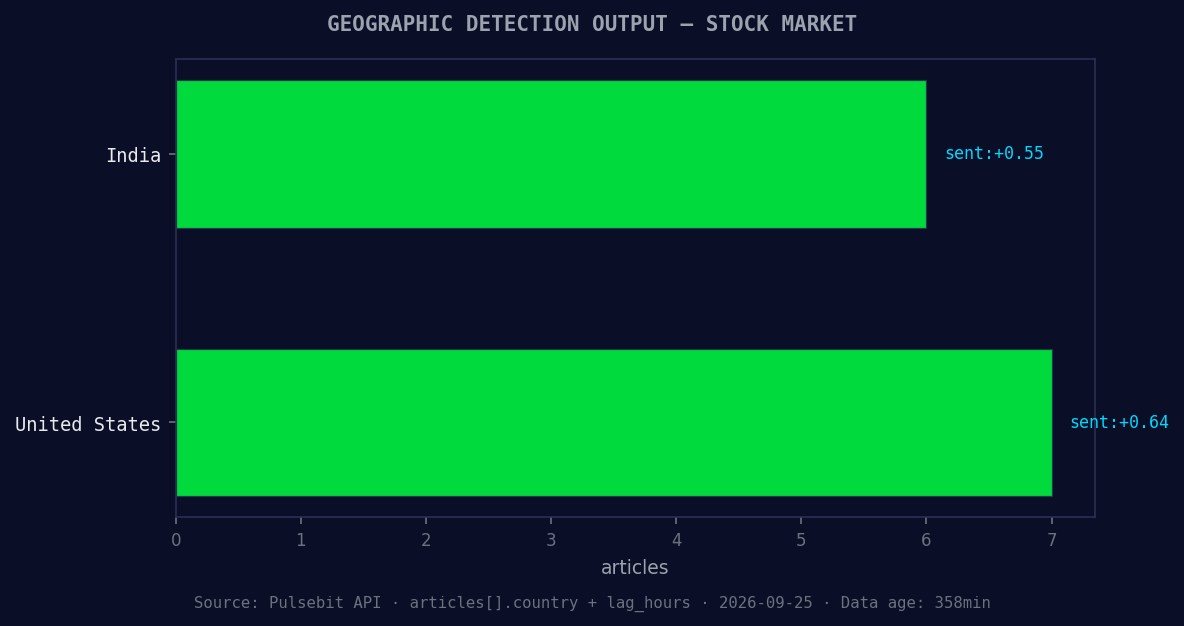
*Geographic detection output for stock market. India leads with 6 articles and sentiment +0.55. Source: Pulsebit /news_recent geographic fields.*
data = response.json()
print(data)
Next, we need to evaluate the narrative framing of the clustered articles. This involves running the reason string through our sentiment endpoint to score its overall sentiment.
# Meta-sentiment moment: running the cluster reason string through POST /sentiment
cluster_reason = "Clustered by shared themes: sensex, mahindra, stock, markets, bounce."
sentiment_response = requests.post(
    'https://api.pulsebit.com/sentiment',
    json={"text": cluster_reason}
)

sentiment_data = sentiment_response.json()
print(sentiment_data)
These two API calls allow us to gather insights not only on the current sentiment but also on the themes driving that sentiment. This is particularly relevant as we see forming trends around stock and market narratives, which are essential for timely decision-making.

Left: Python GET /news_semantic call for 'stock market'. Right: returned JSON response structure (clusters: 3). Source: Pulsebit /news_semantic.
So, what can you build with this pattern? Here are three specific ideas:
Geo-Sentiment Tracker: Use the geographic origin filter to build a sentiment tracker specifically for English-language articles on the stock market. Set a threshold of momentum > +0.200 to catch significant spikes.
Narrative Analyzer: Implement the meta-sentiment loop to analyze the narrative framing of stock market articles. Score the sentiment of cluster reasons like "Clustered by shared themes: sensex, mahindra, stock, markets, bounce." This helps you understand how sentiment is shaped through media narratives.
Anomaly Alert System: Create a system that sends alerts when you detect a momentum spike over +0.200 in stock market sentiment, especially when the dominant entity is a major news outlet like Yahoo Finance. This ensures you stay ahead of the curve.
By implementing these builds, you’ll ensure you’re not just keeping up with market sentiment but staying ahead of it. You can get started with our API documentation at pulsebit.lojenterprise.com/docs. In under 10 minutes, you can copy-paste and run this code to start capturing those valuable insights.


Top comments (0)