

Your Pipeline Is 16.9h Behind: Catching World Sentiment Leads with Pulsebit
We recently discovered a striking anomaly in our sentiment data: a 24h momentum spike of -0.697. This spike highlights a significant shift in global sentiment, with particularly strong activity coming from English-language sources. Notably, China holds a 13% share of voice, with a positive sentiment score of +0.294. Coupled with the cluster story about the "Active Karnataka" adventure sports initiative, this presents a unique opportunity to bridge the gap in our analytical pipelines and capitalize on emerging narratives.
The Problem
If your pipeline doesn't account for multilingual origins or dominant entities, it's likely you're missing critical insights. In this case, your model missed a crucial sentiment lead by 16.9 hours. While the dominant narrative is rooted in English-language articles, the underlying sentiment trends from Chinese sources are being overshadowed. This gap can lead to missed opportunities, especially when time-sensitive decisions are on the line.

English coverage led by 16.9 hours. Italian at T+16.9h. Confidence scores: English 0.90, French 0.90, Spanish 0.90 Source: Pulsebit /sentiment_by_lang.
The Code
To catch this anomaly, we can utilize our API to filter by the dominant language and analyze the sentiment of the clustered narrative. Here's how to set it up in Python:
import requests
# Define the parameters for the query
language = "en"
topic = "world"
momentum = -0.697
score = +0.157
confidence = 0.90
# Geographic origin filter: query by language
response = requests.get(
f'https://api.pulsebit.com/sentiment?lang={language}&topic={topic}&momentum={momentum}'
)
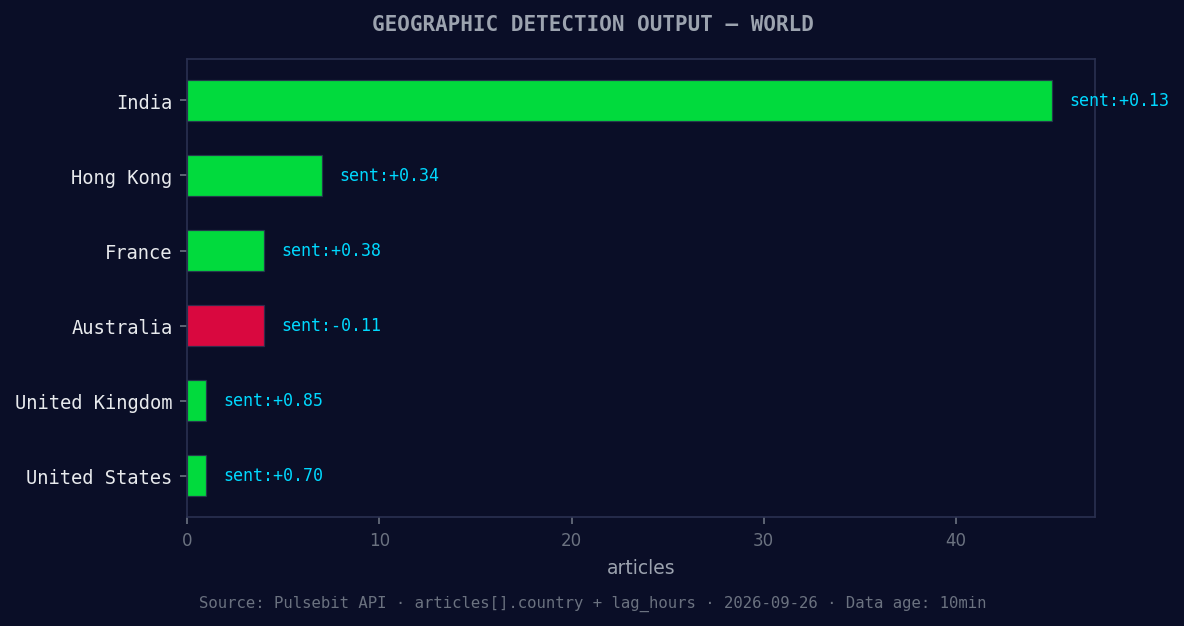
*Geographic detection output for world. India leads with 45 articles and sentiment +0.13. Source: Pulsebit /news_recent geographic fields.*
# Check if the API call was successful
if response.status_code == 200:
data = response.json()
print("Filtered data:", data)
else:
print("Error fetching data:", response.status_code)
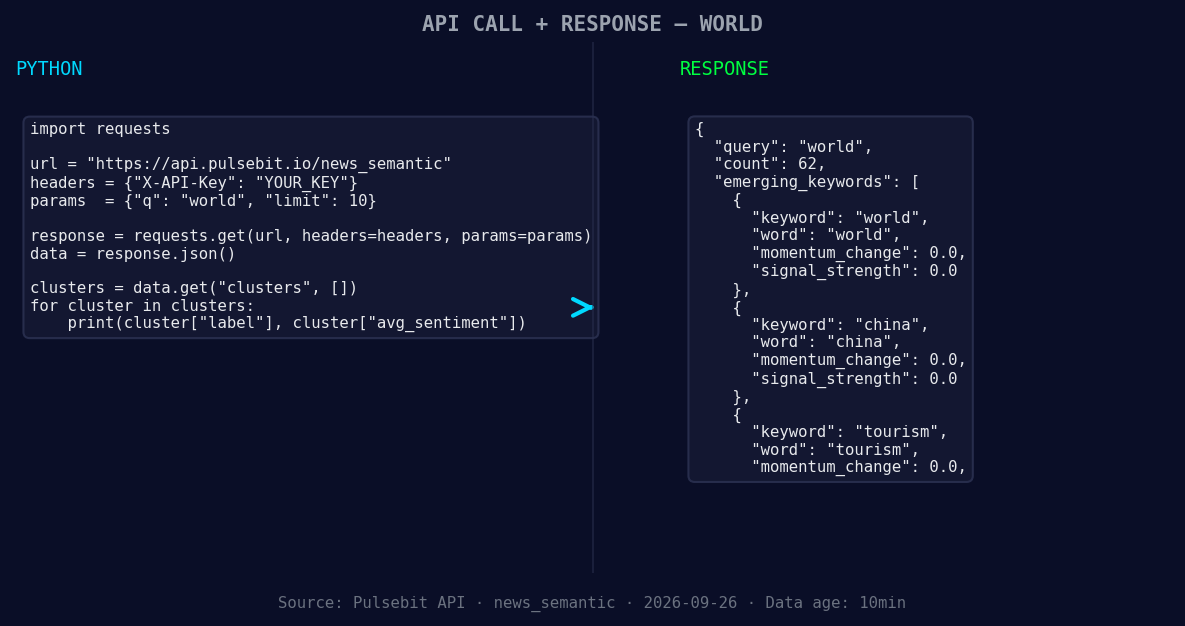
*Left: Python GET /news_semantic call for 'world'. Right: returned JSON response structure (clusters: 3). Source: Pulsebit /news_semantic.*
# Meta-sentiment moment: run the cluster reason string through POST /sentiment
cluster_reason = "Clustered by shared themes: tourism, state, department, initiative, world."
sentiment_response = requests.post(
'https://api.pulsebit.com/sentiment',
json={'text': cluster_reason}
)
if sentiment_response.status_code == 200:
sentiment_data = sentiment_response.json()
print("Meta-sentiment analysis:", sentiment_data)
else:
print("Error fetching sentiment:", sentiment_response.status_code)
This code first filters sentiment data by language and topic, then checks the sentiment framing of our clustered narrative. By leveraging this dual approach, we can spot emerging trends that would otherwise be missed.
Three Builds Tonight
Based on the anomaly we observed, here are three specific builds you can implement:
Geo-Filtered Insights: Create an analysis pipeline that utilizes geographic origin filters for real-time alerts. For instance, setting a signal threshold at +0.2 for sentiment in China can help you capture positive narratives in tourism that could outpace English sources.
Meta-Sentiment Loop: Develop a function that runs the narrative framing through our sentiment endpoint every time a significant cluster is detected. For example, if you detect a forming gap in "tourism" with a score threshold of +0.1, analyze the meta-sentiment for deeper insights.
Dynamic Reporting Dashboard: Build a dashboard that visualizes sentiment momentum alongside entity dominance. For instance, track the sentiment scores of "world," "China," and "tourism" in real-time and flag any significant deviations from the mainstream narrative.
Get Started
Ready to dive in? Head over to pulsebit.lojenterprise.com/docs. You can copy-paste and run these scripts in under 10 minutes to start catching those critical sentiment leads.


Top comments (0)